Charts
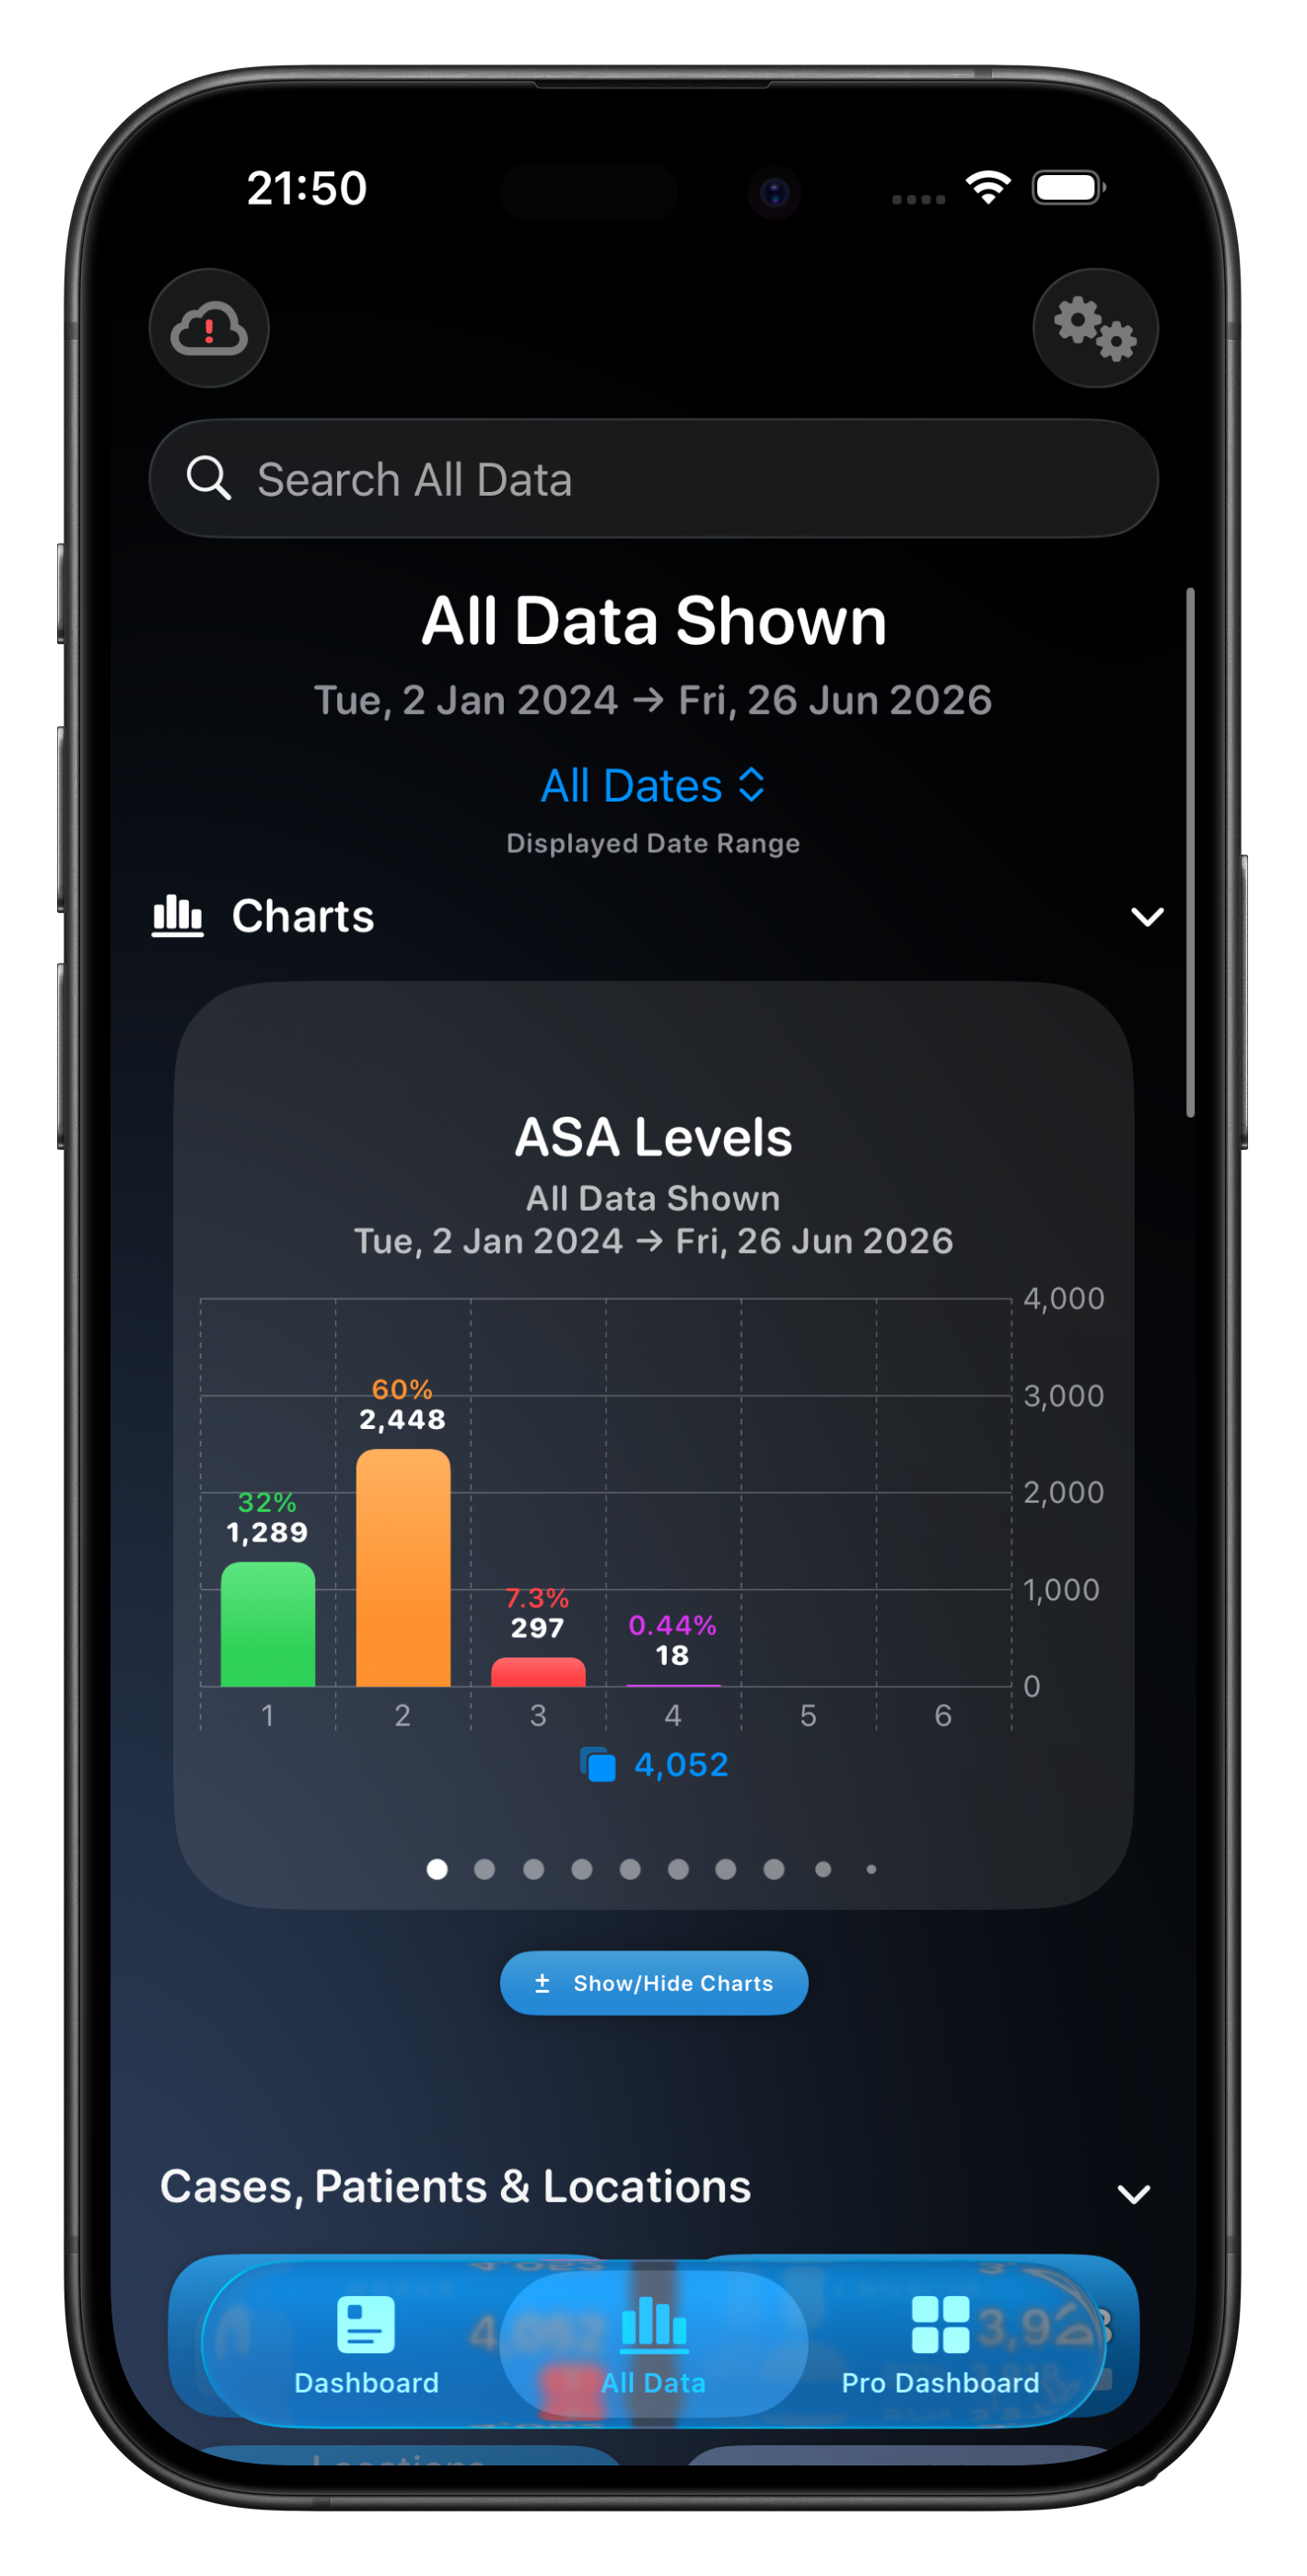
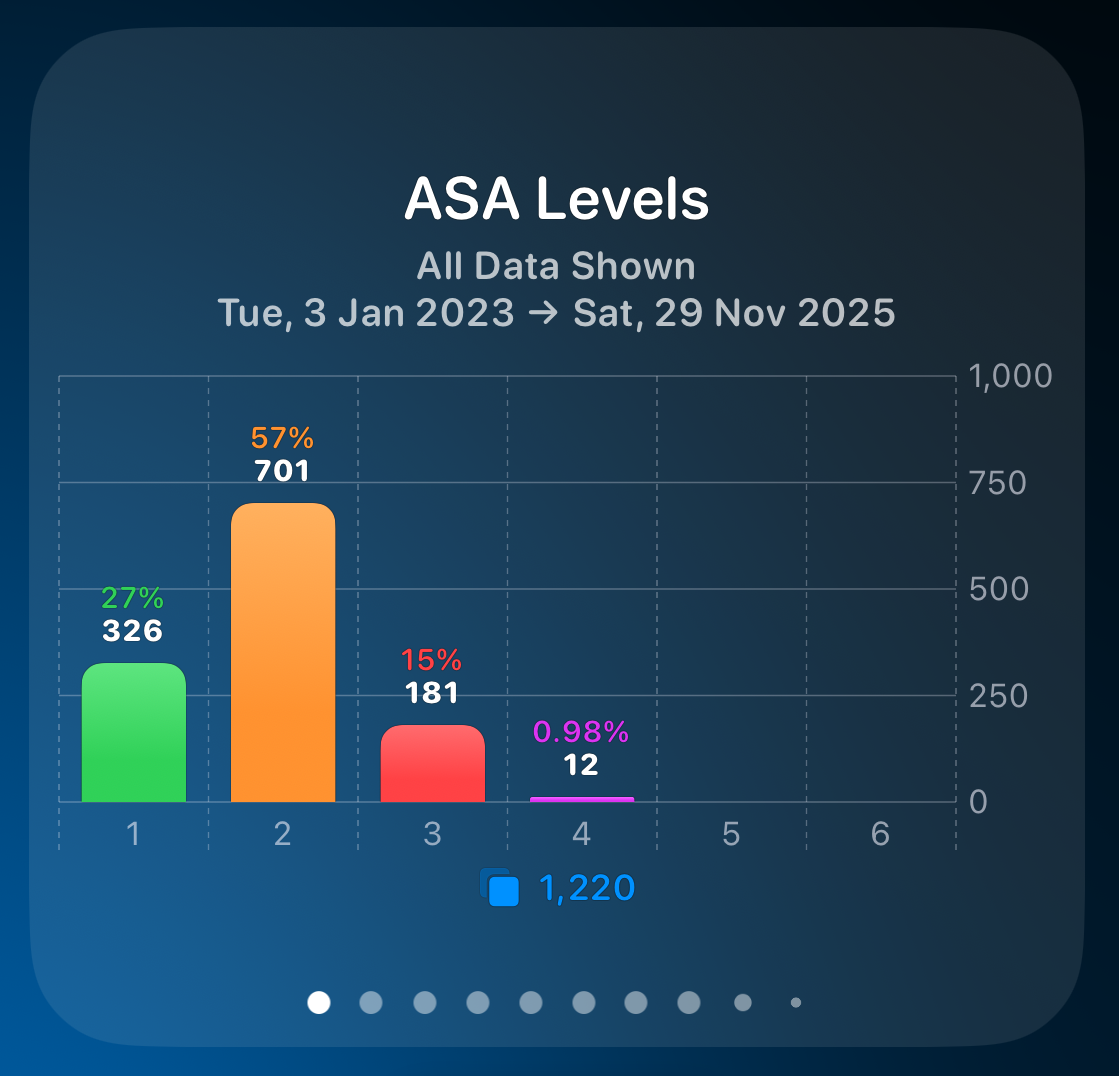
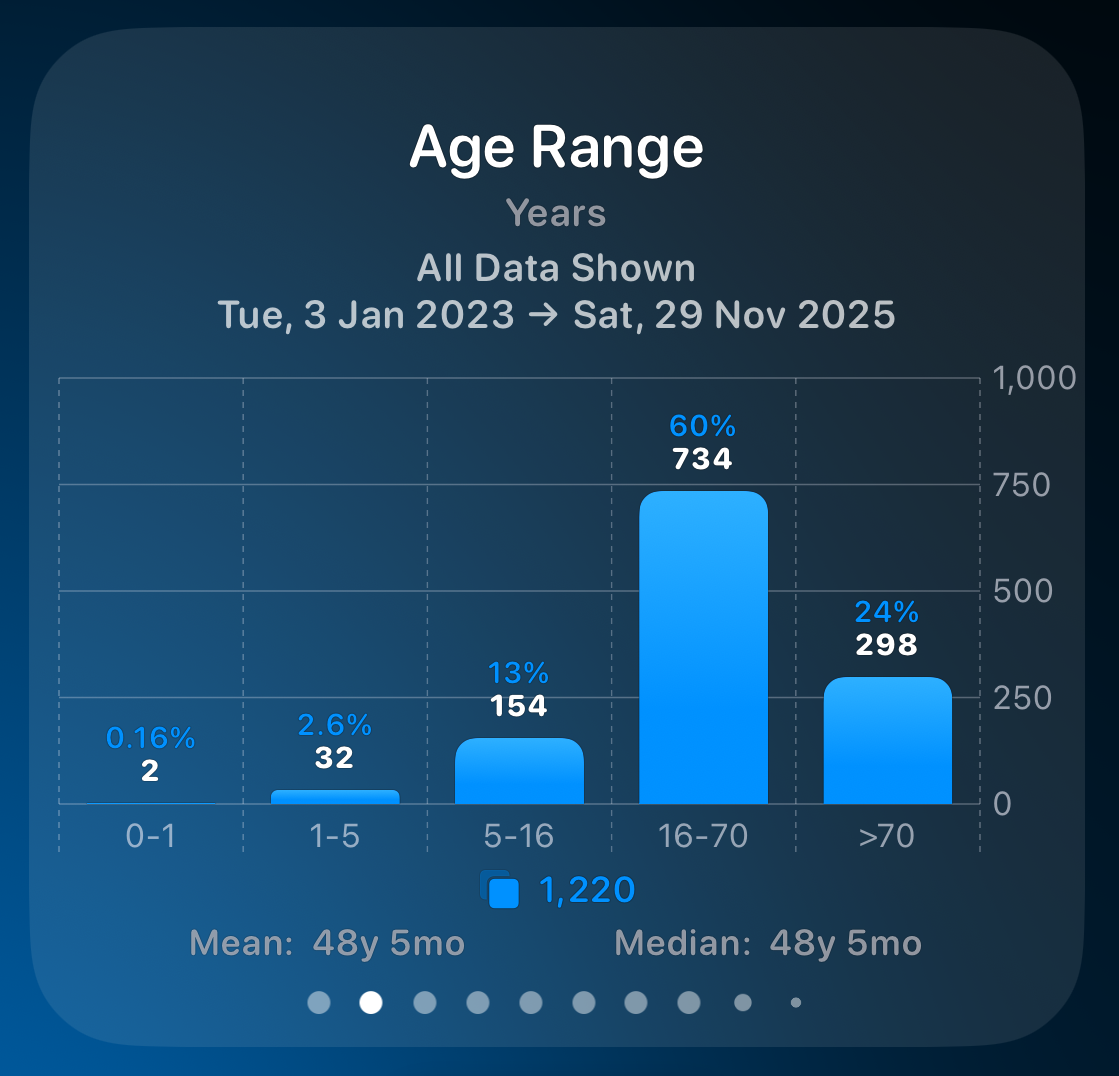
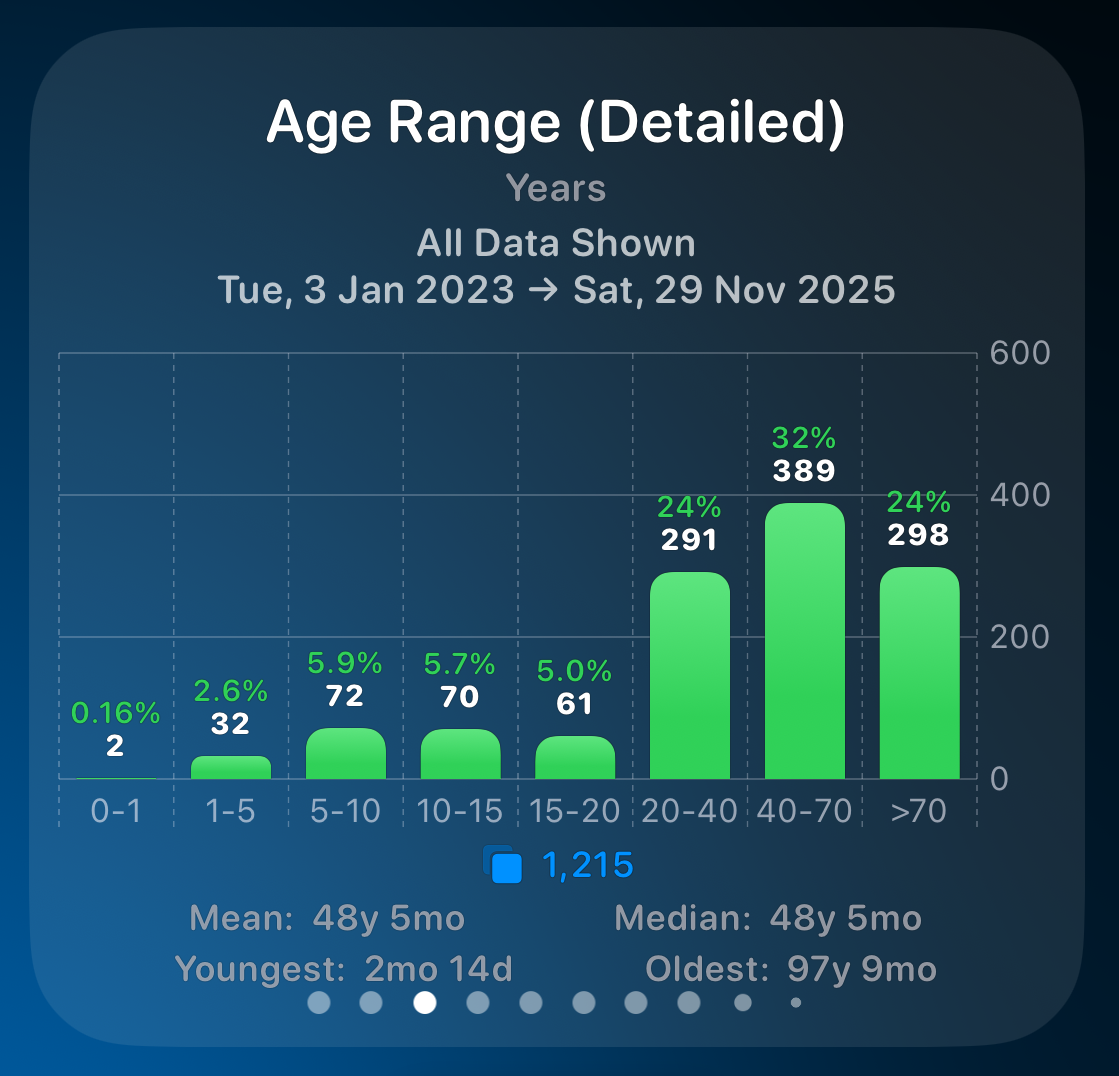
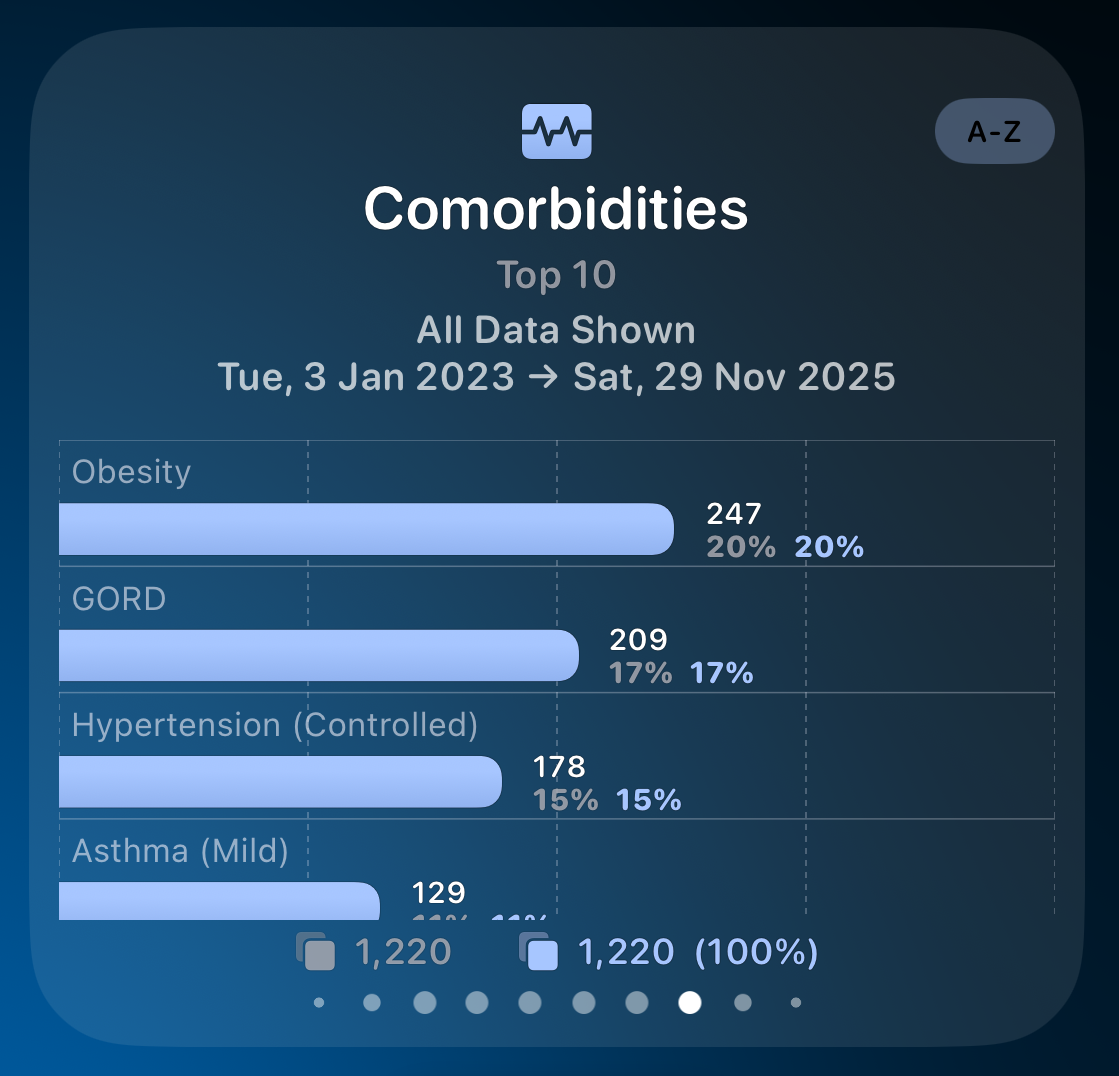
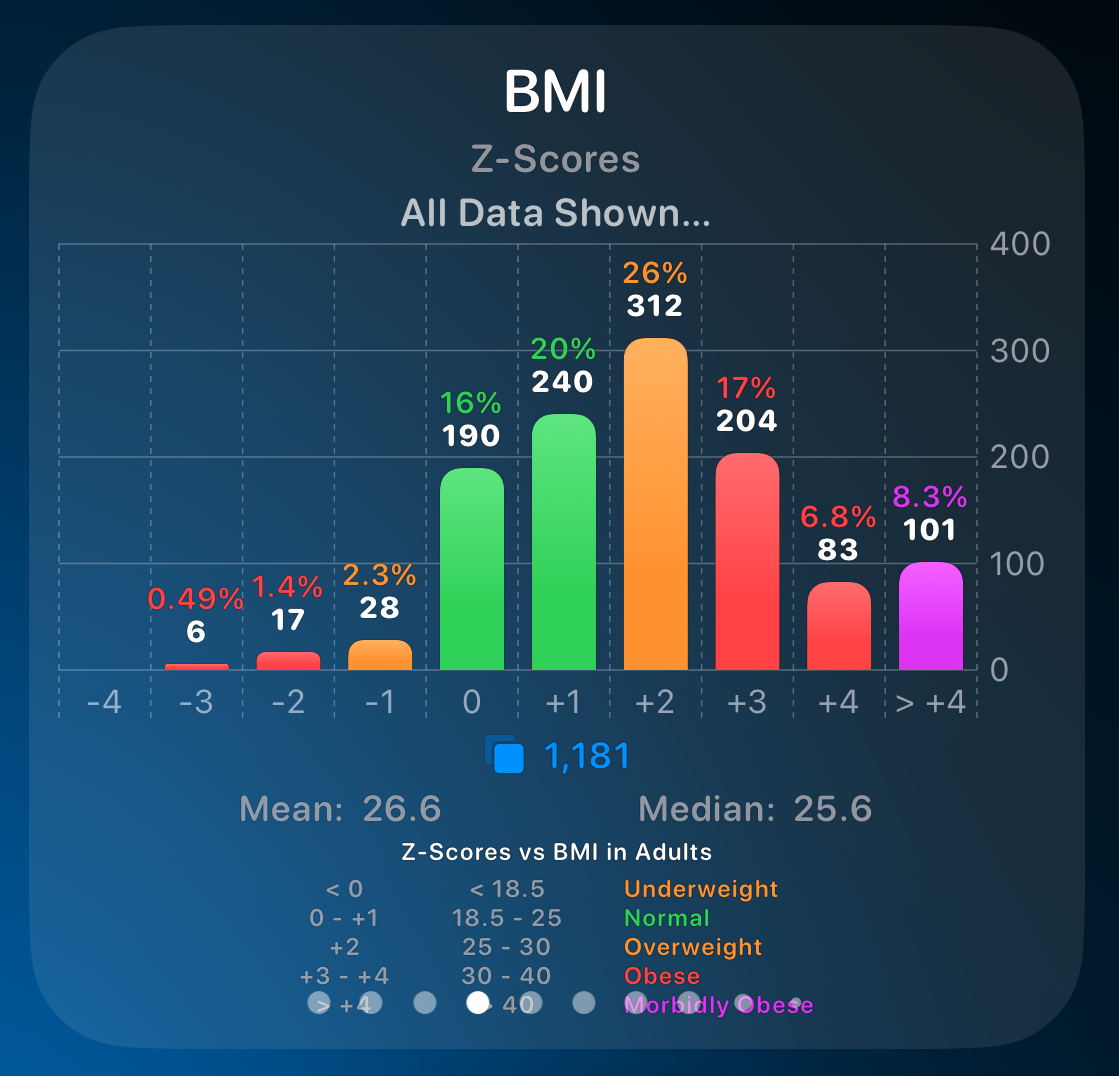
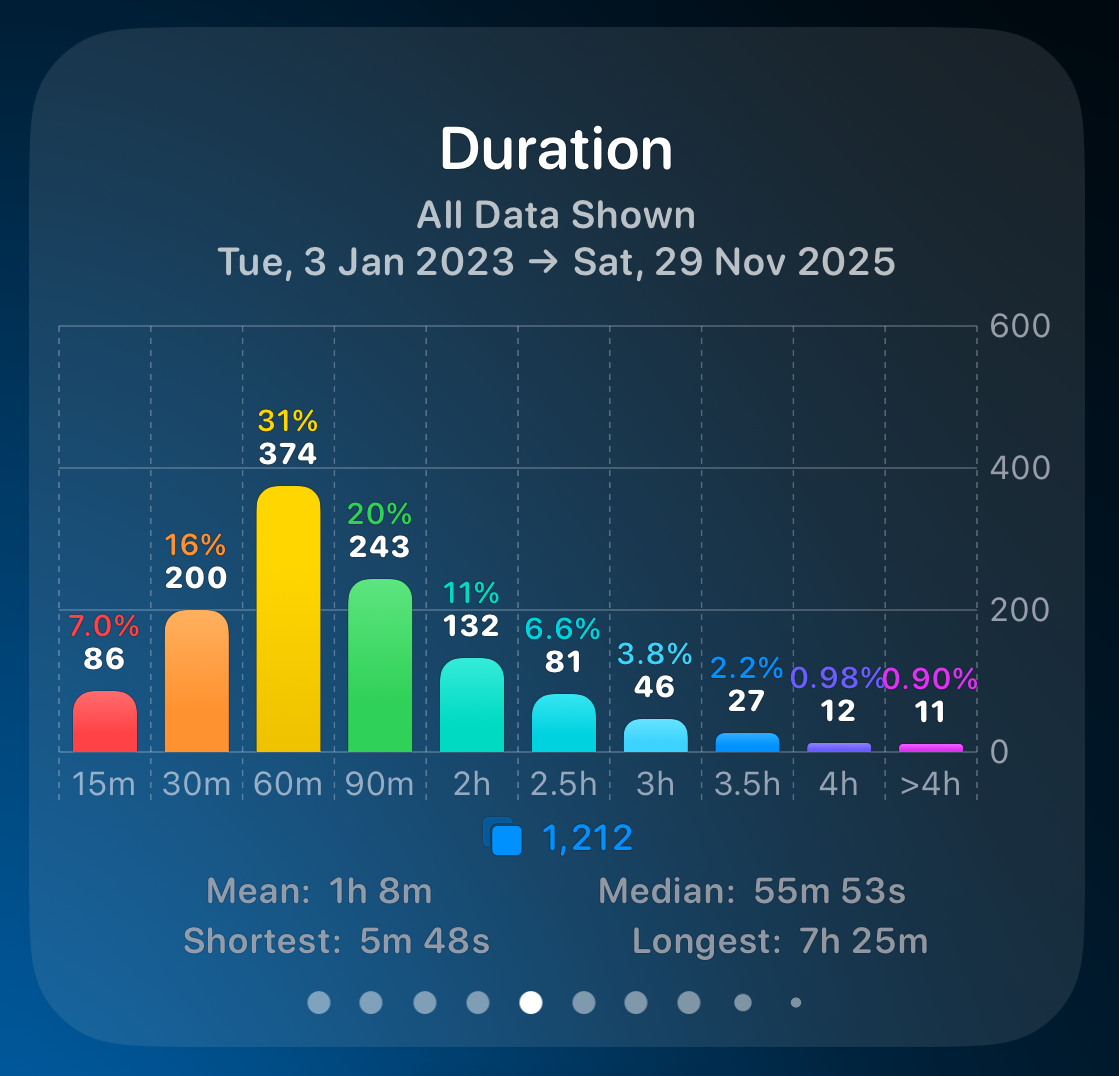
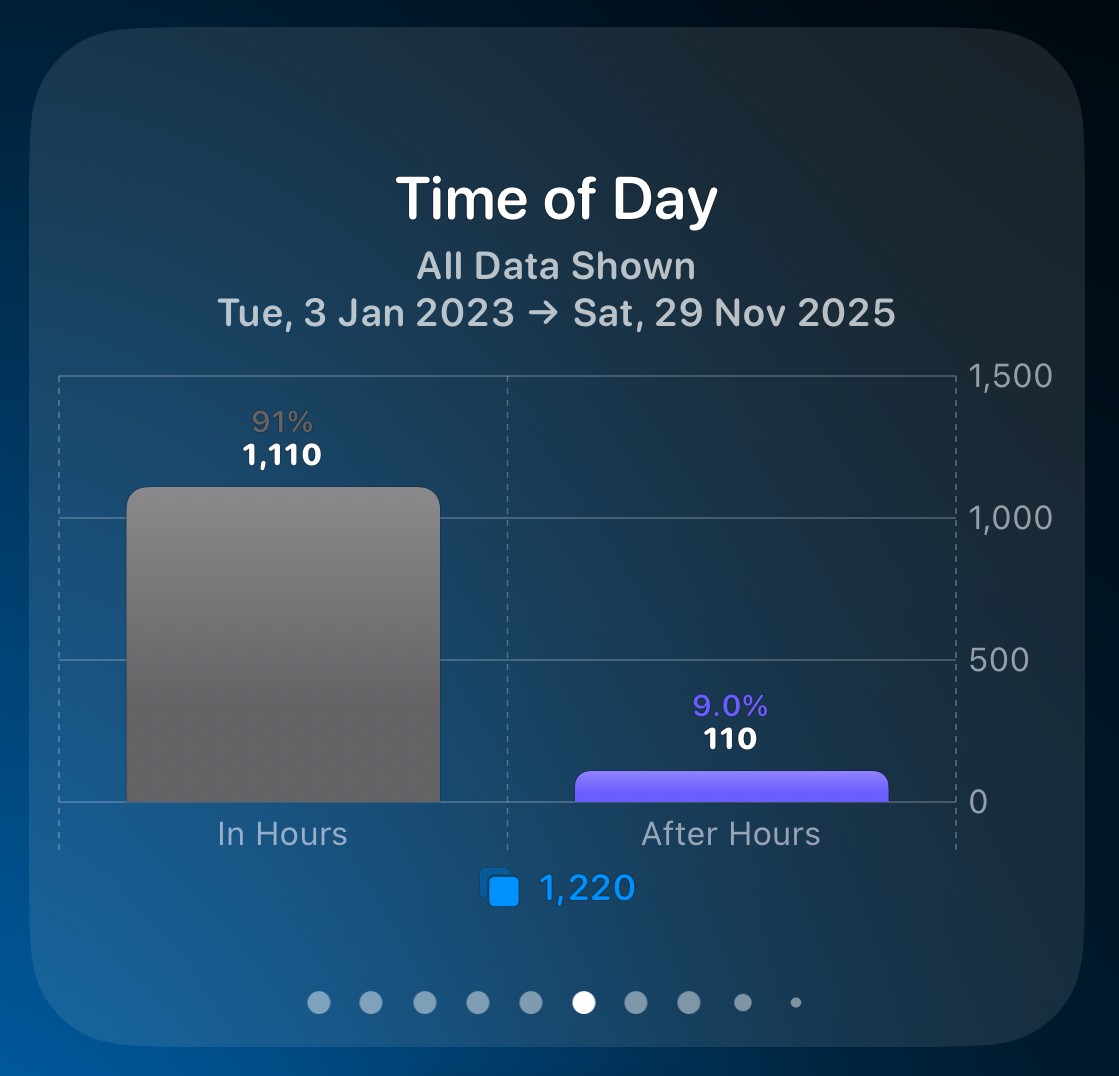
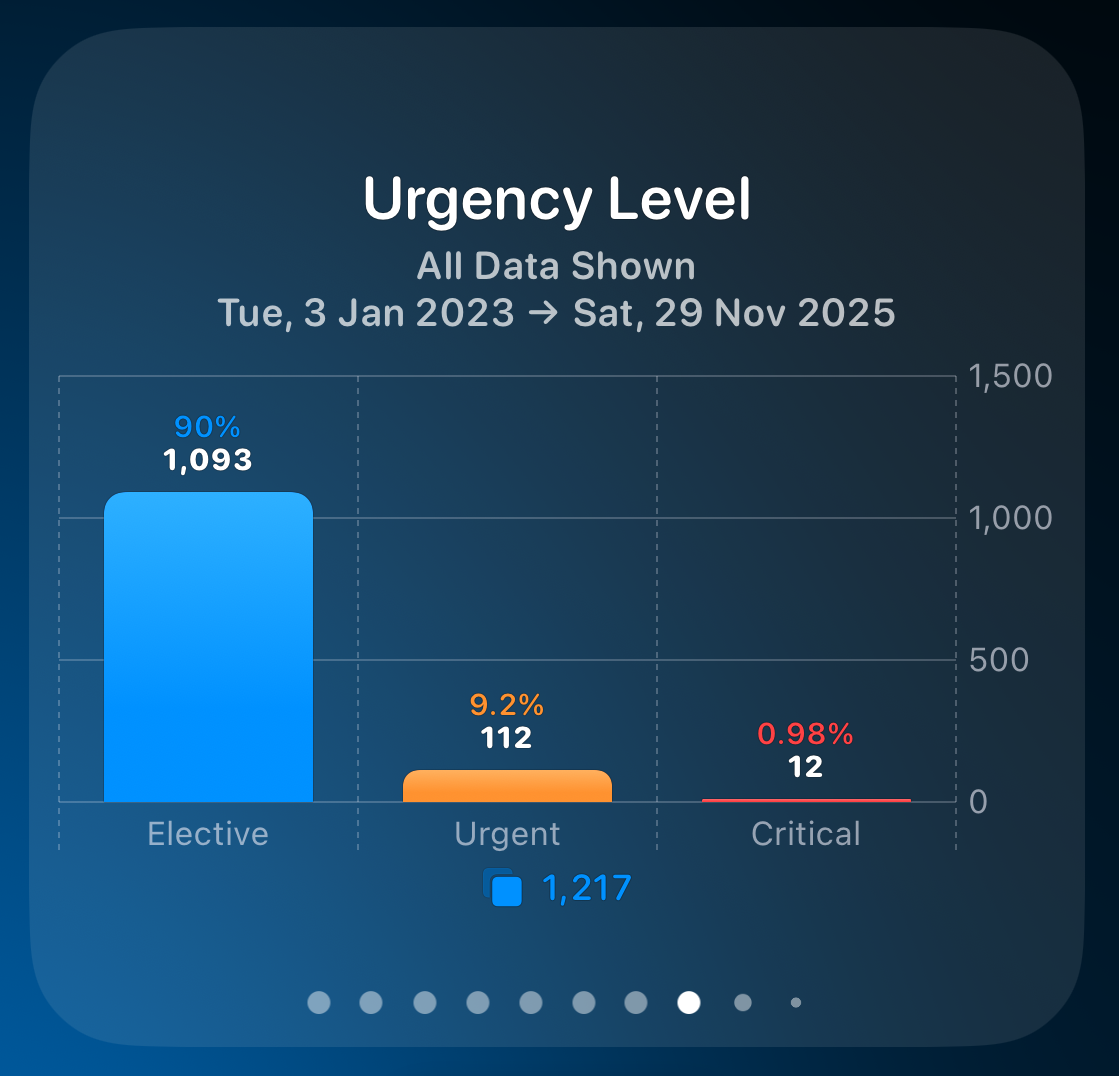
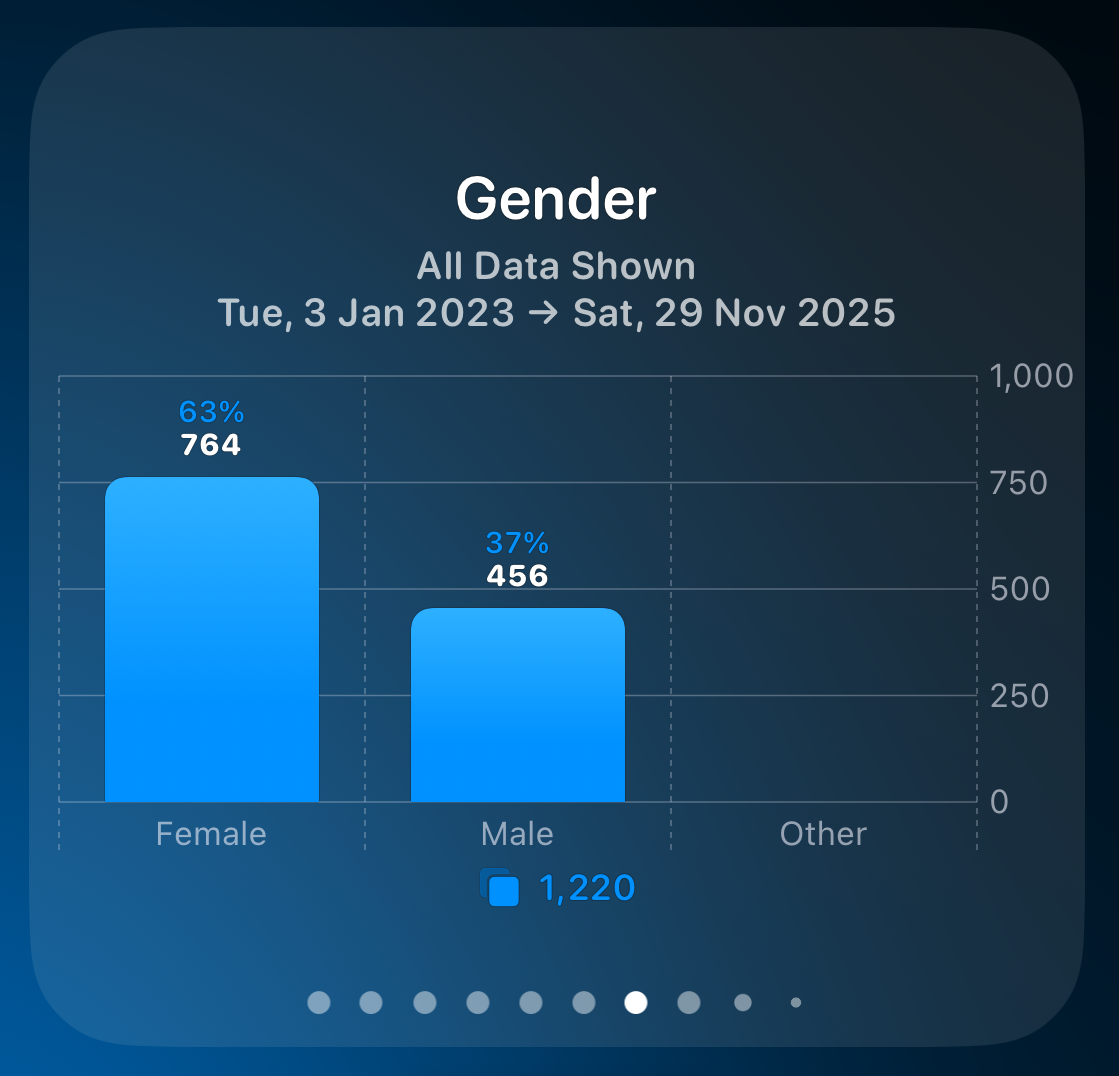
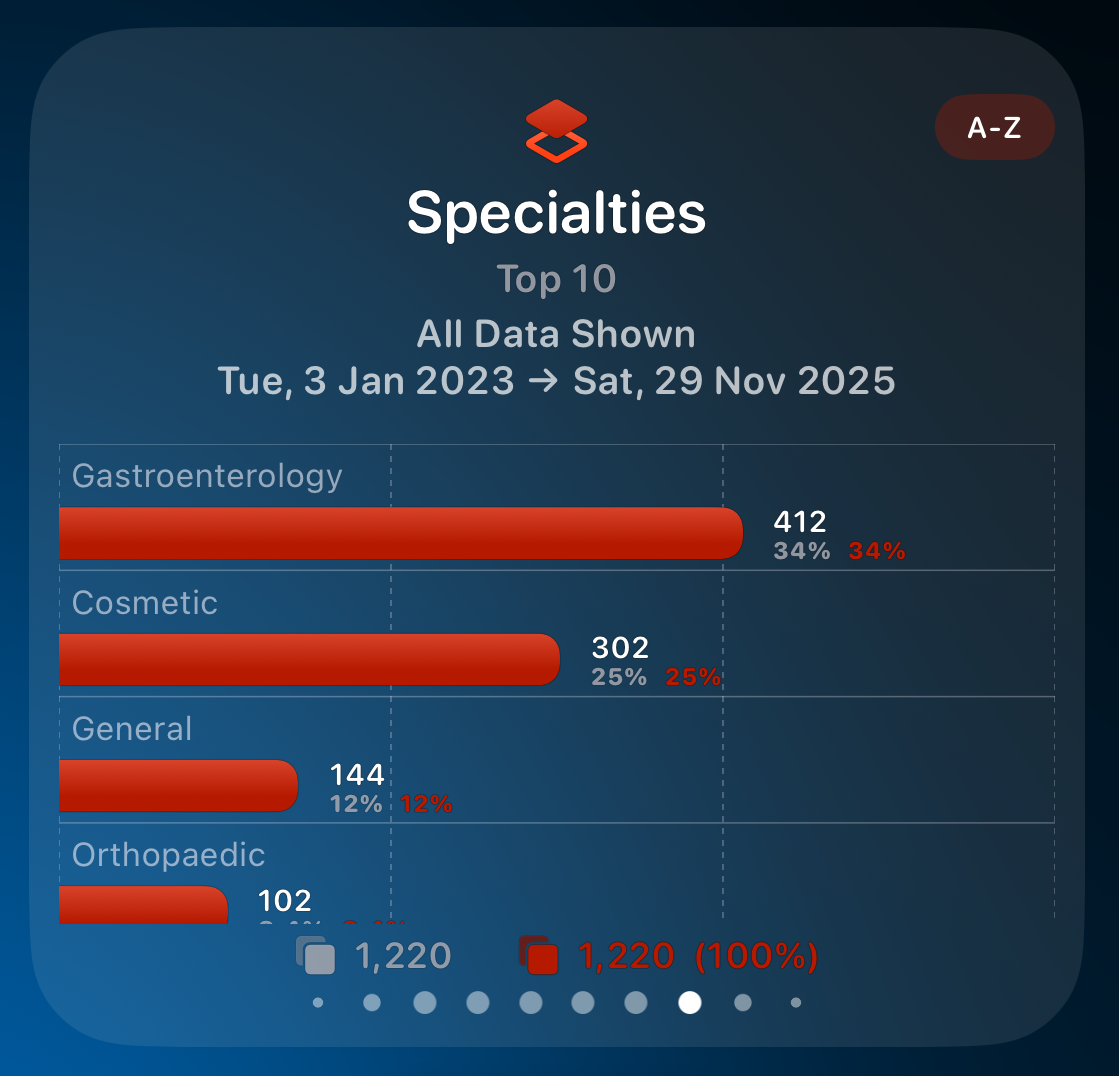
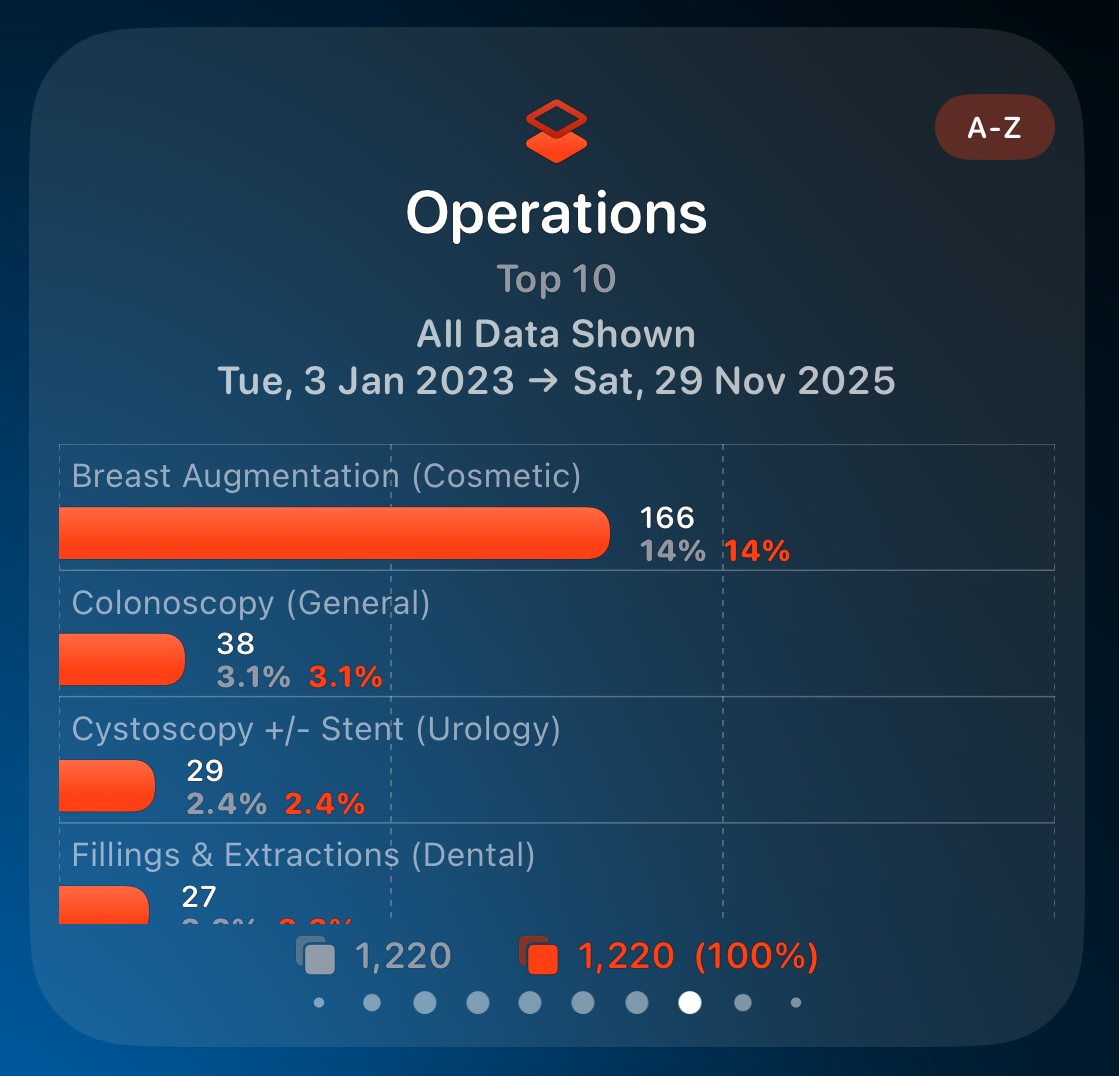
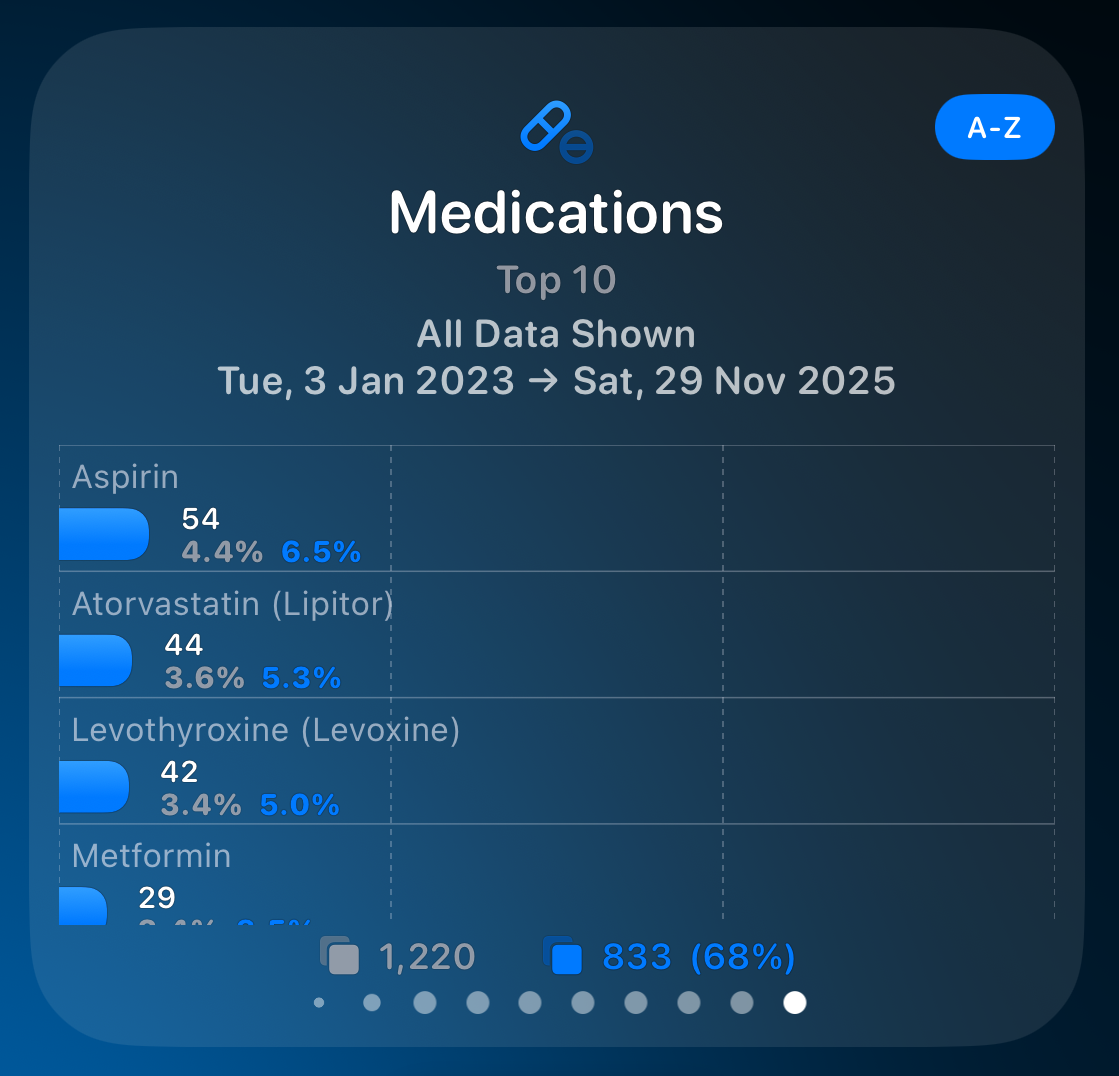
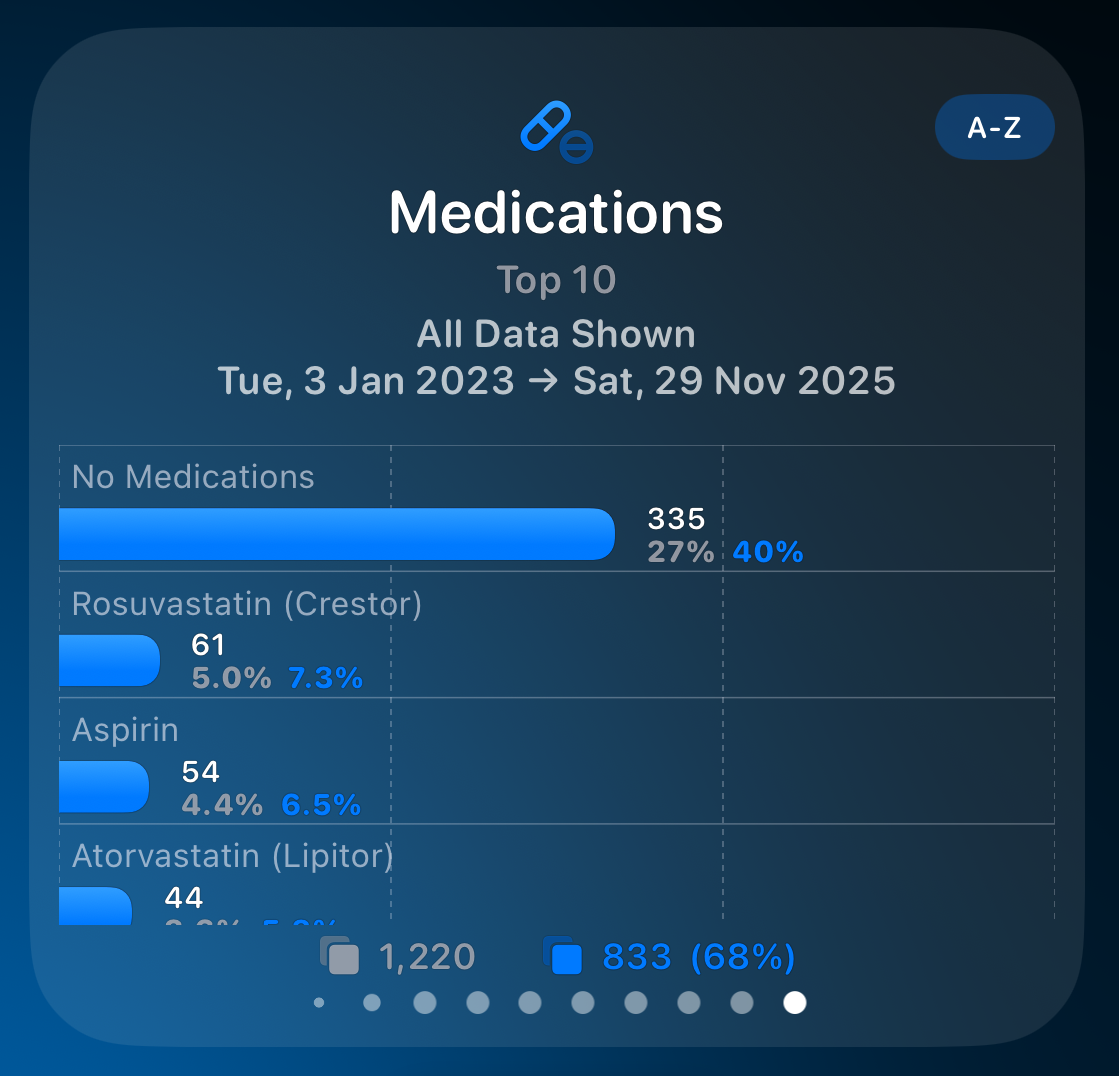
Charts in Somnus are dynamic and update in real-time as your data changes either via importing, cloud syncing or searching.
Both the Dashboard & All data screens have their own charts reflecting the Cases bound by the date ranges on those screens. Both their visibility and order is configurable by using the Show/Hide Charts button.
Personal Lists that you create will also have charts available for display.
Swipe on charts to move between them, or use the scrubbing index (dots) beneath the charts to quickly change them.
Use the context menu on most charts to either save the chart as an image to your Photo Library, or copy to the clipboard to paste anywhere you like.

Category Lists
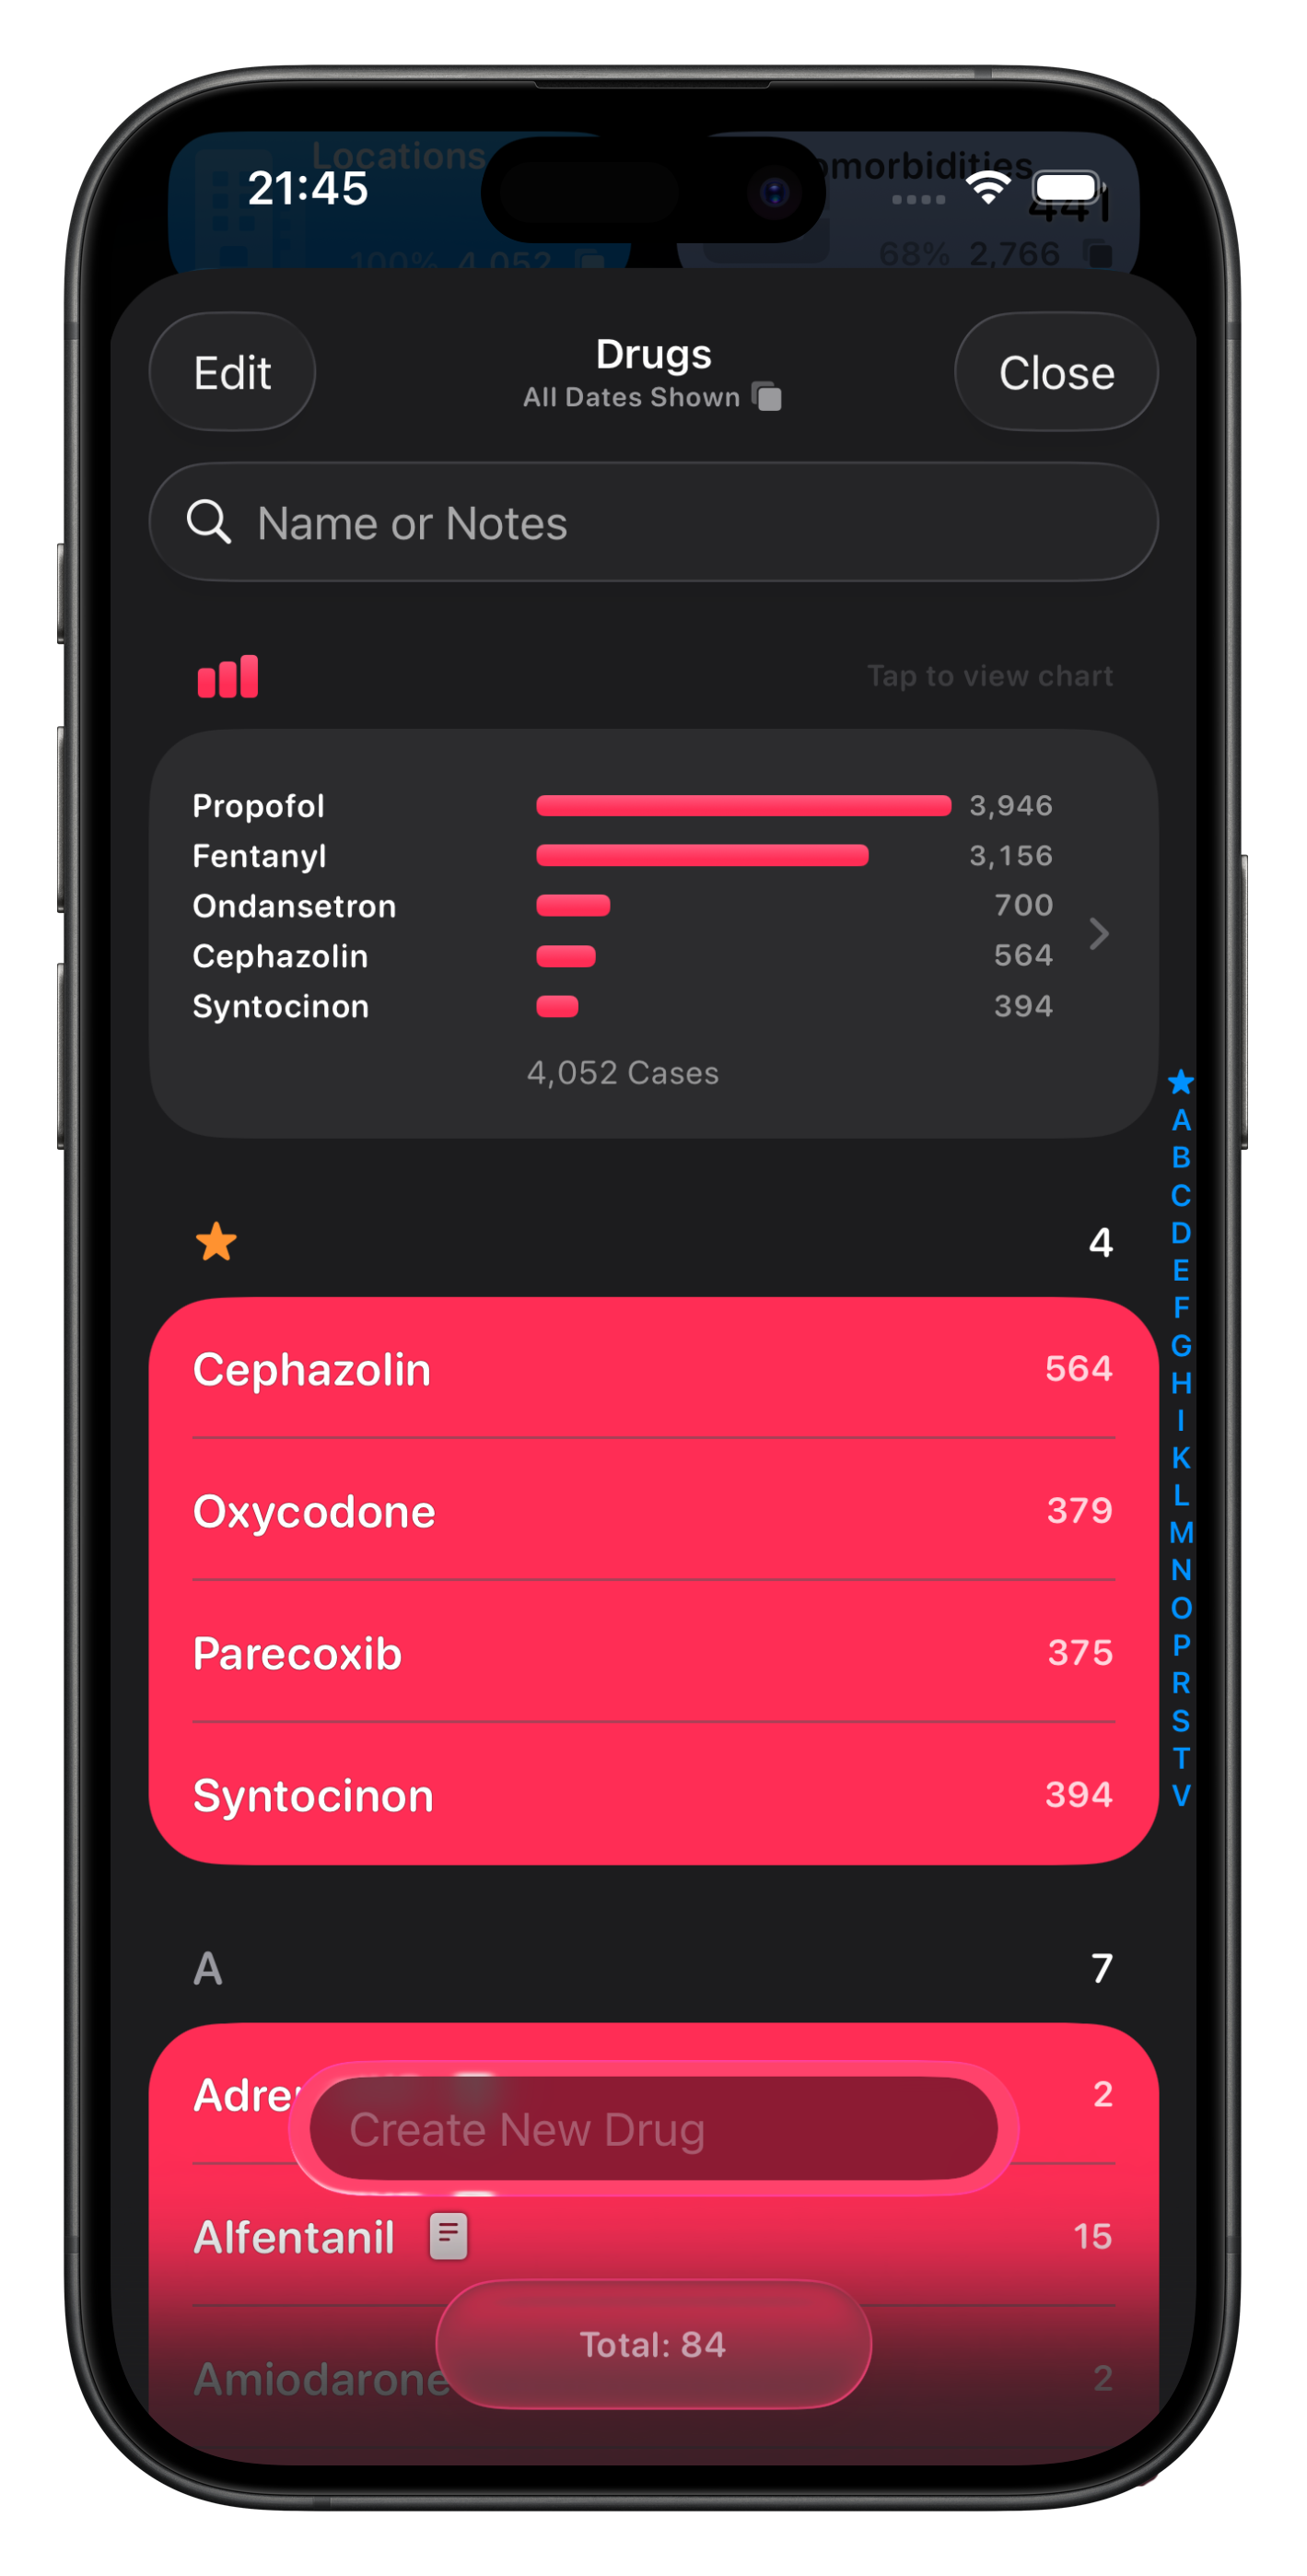
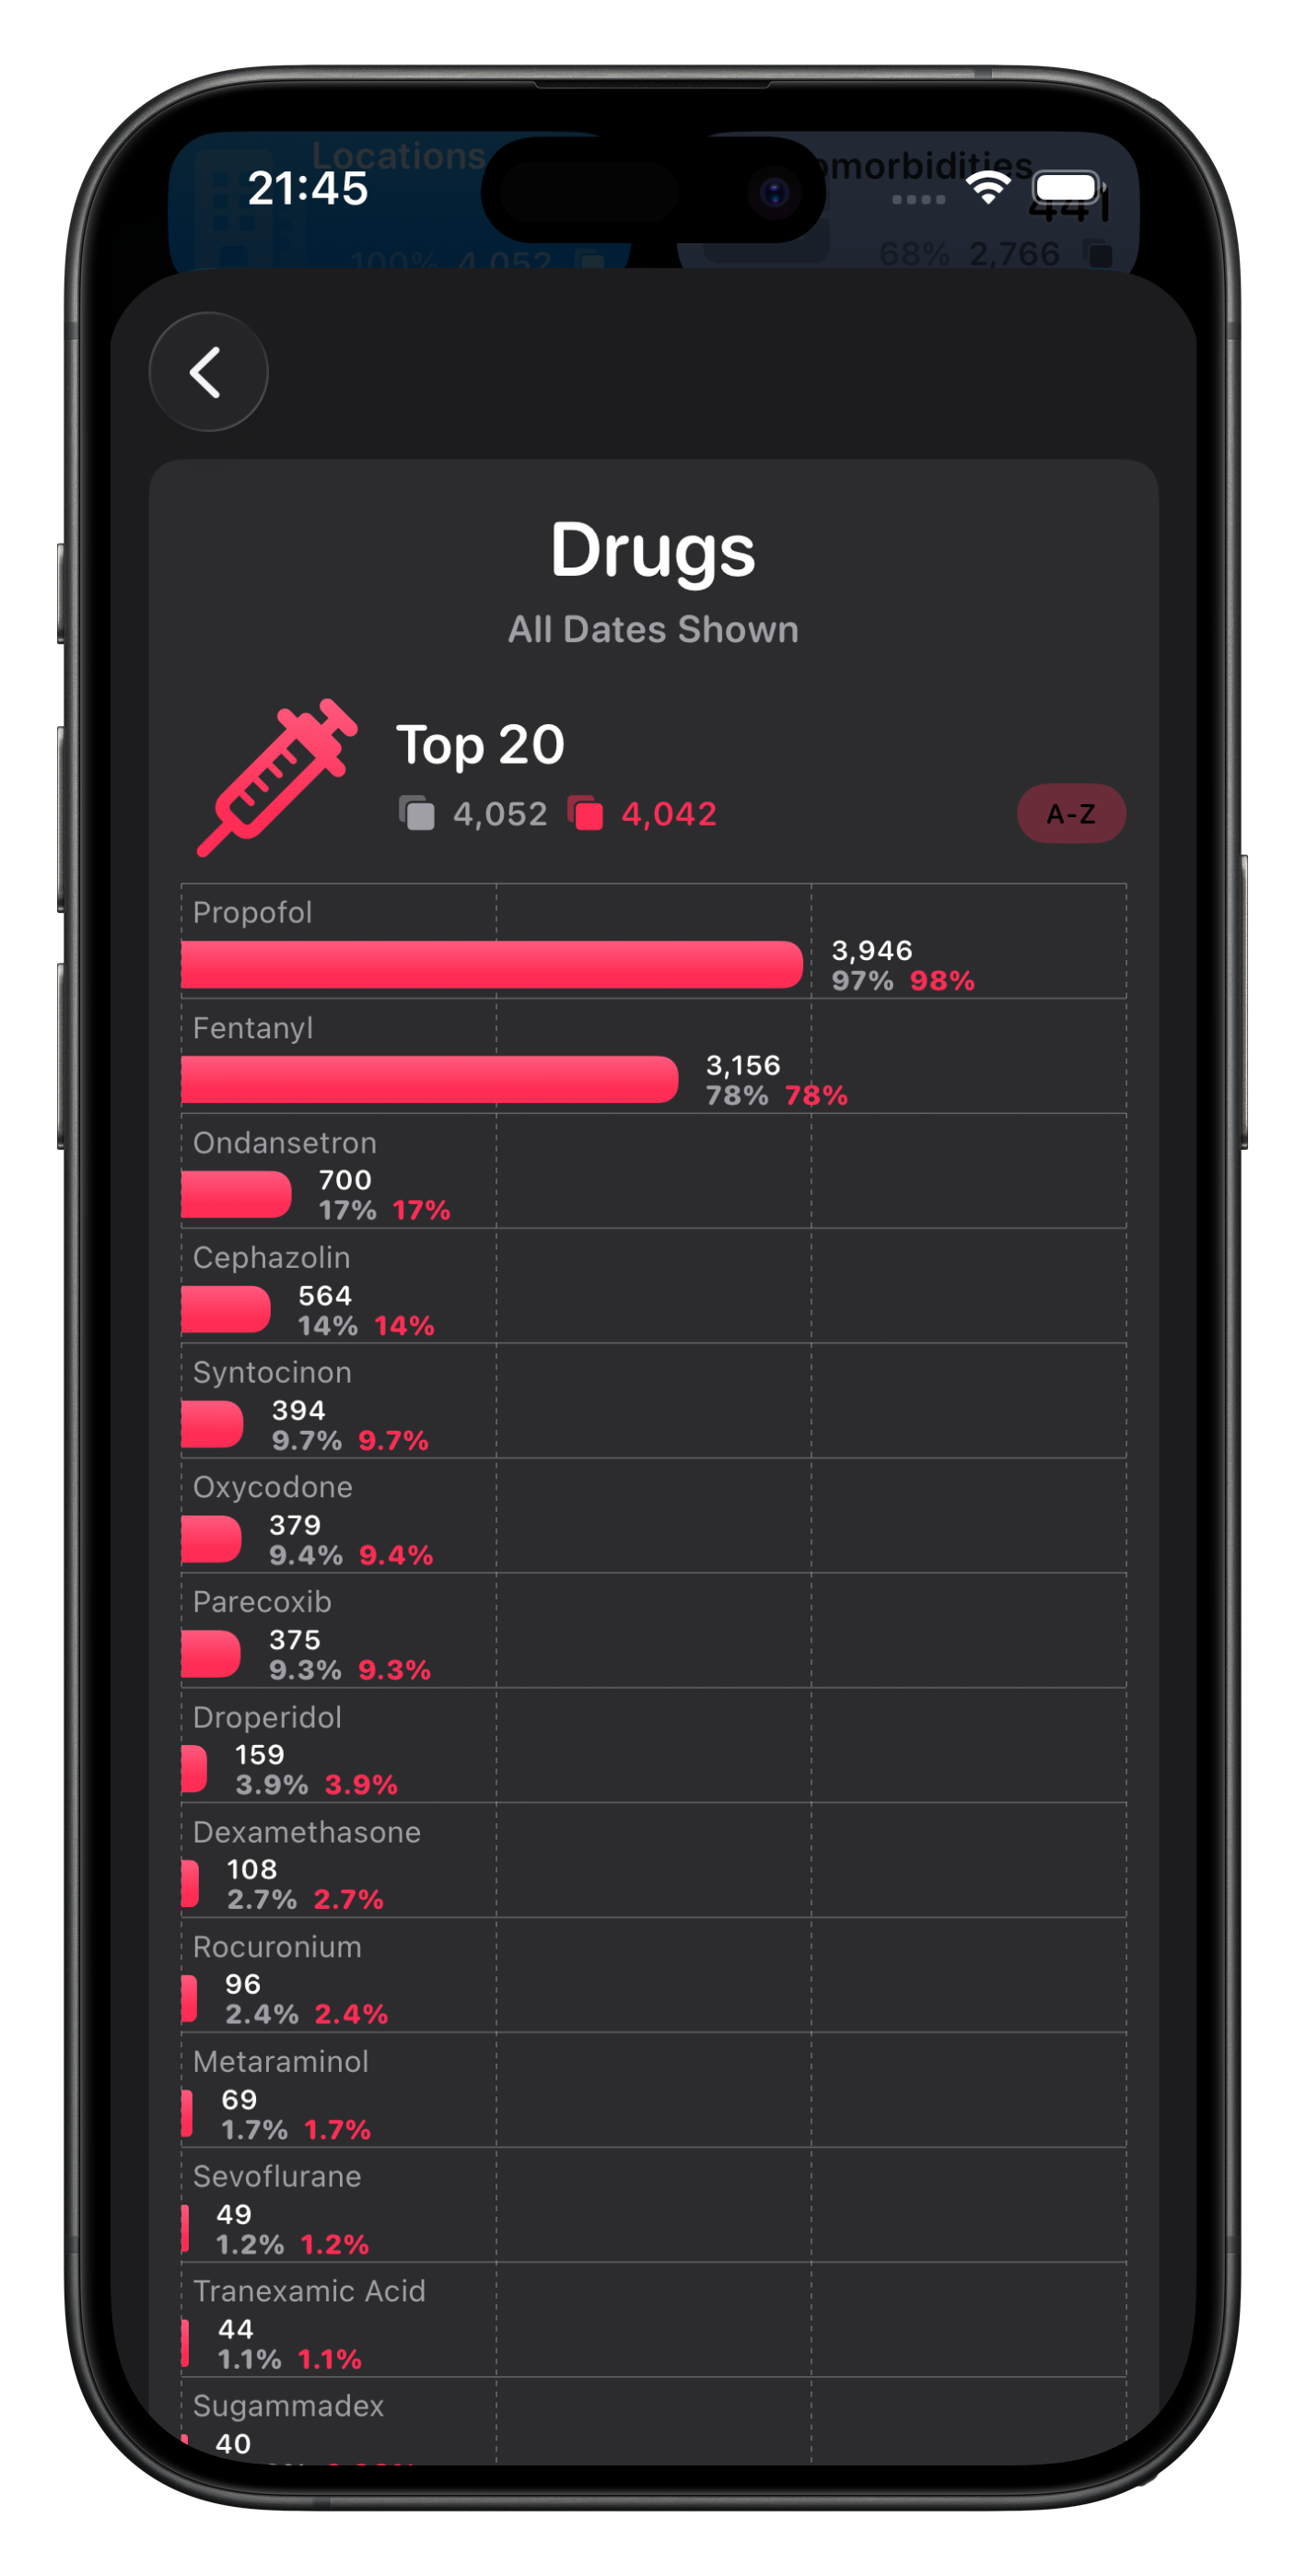
When viewing lists a small chart at the top will show you the Top 5 items in that category. Tapping on it will reveal a larger Top 20 Chart.
Charts in list views will show a maximum of 20 items in each category, by case count, and for charts on the All Data & Dashboard screens this is limited to the top 10 items.
To display even more items in a Chart, you can add a custom Chart Tile on the Pro Dashboard.
Anatomy of a Chart
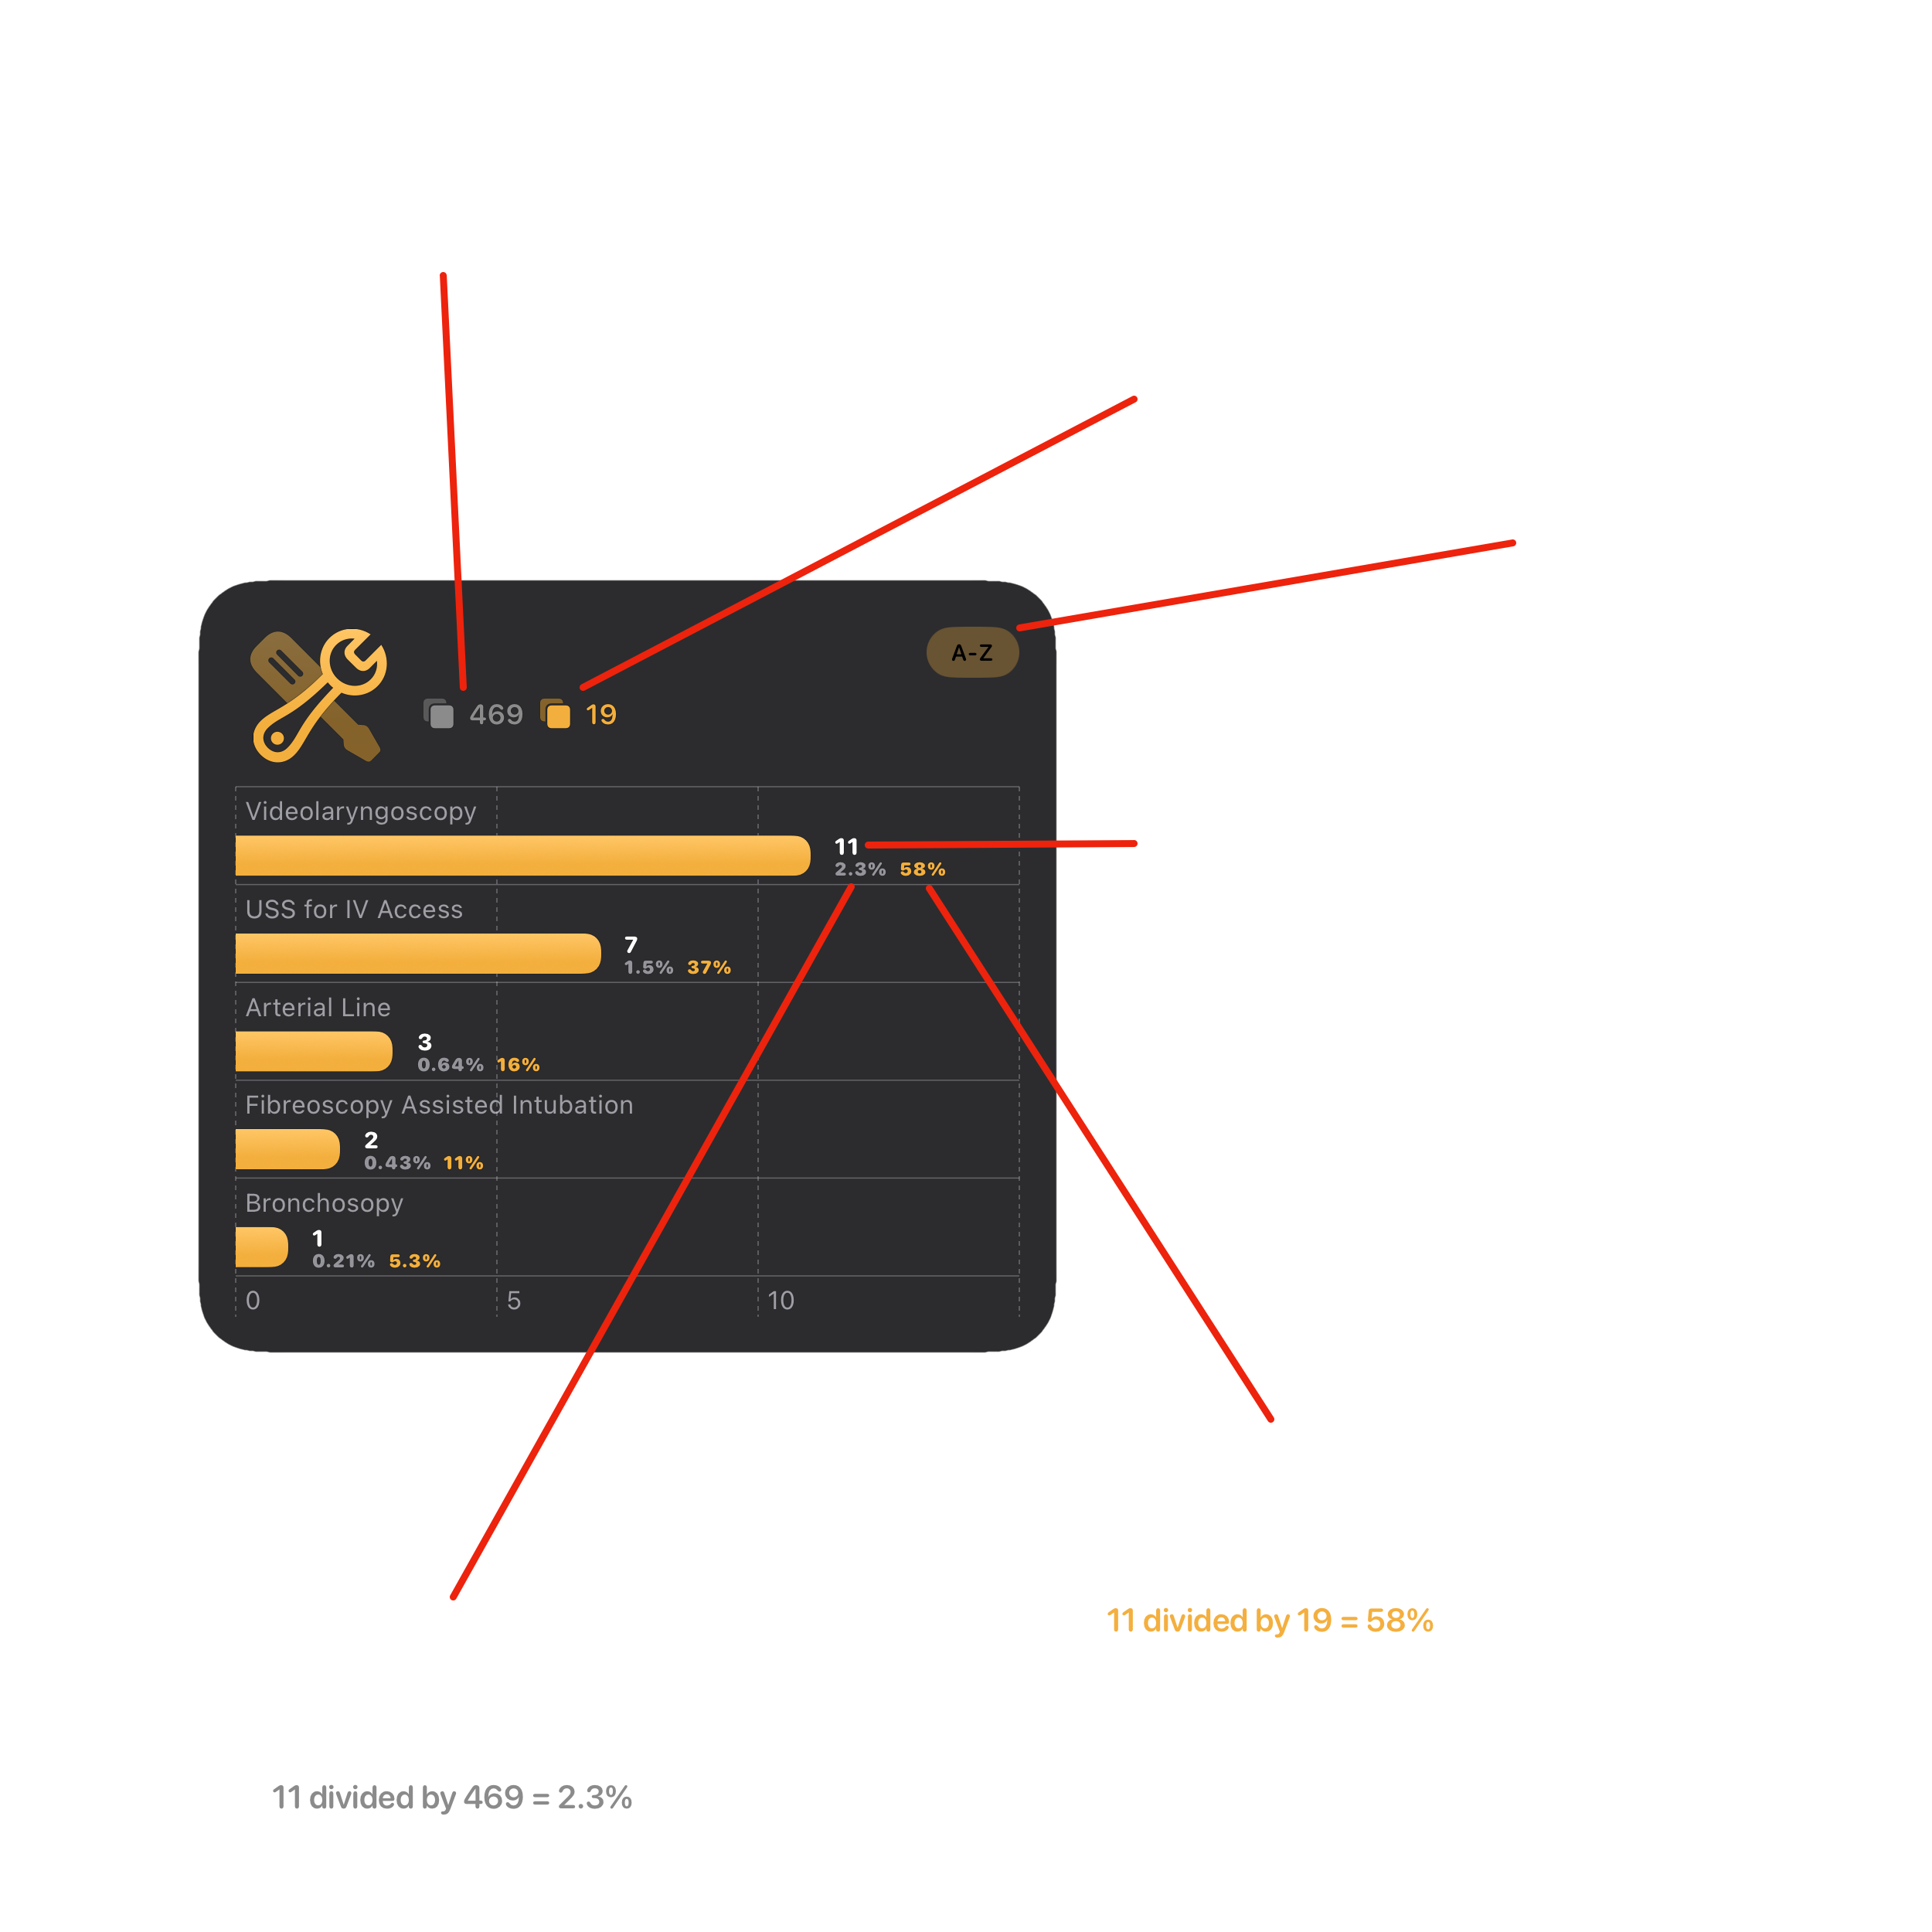
The charts display a lot of information in a small space. In this example we’re looking at All Procedures in 2025, as viewed by the Summary Card on the All Data Screen.