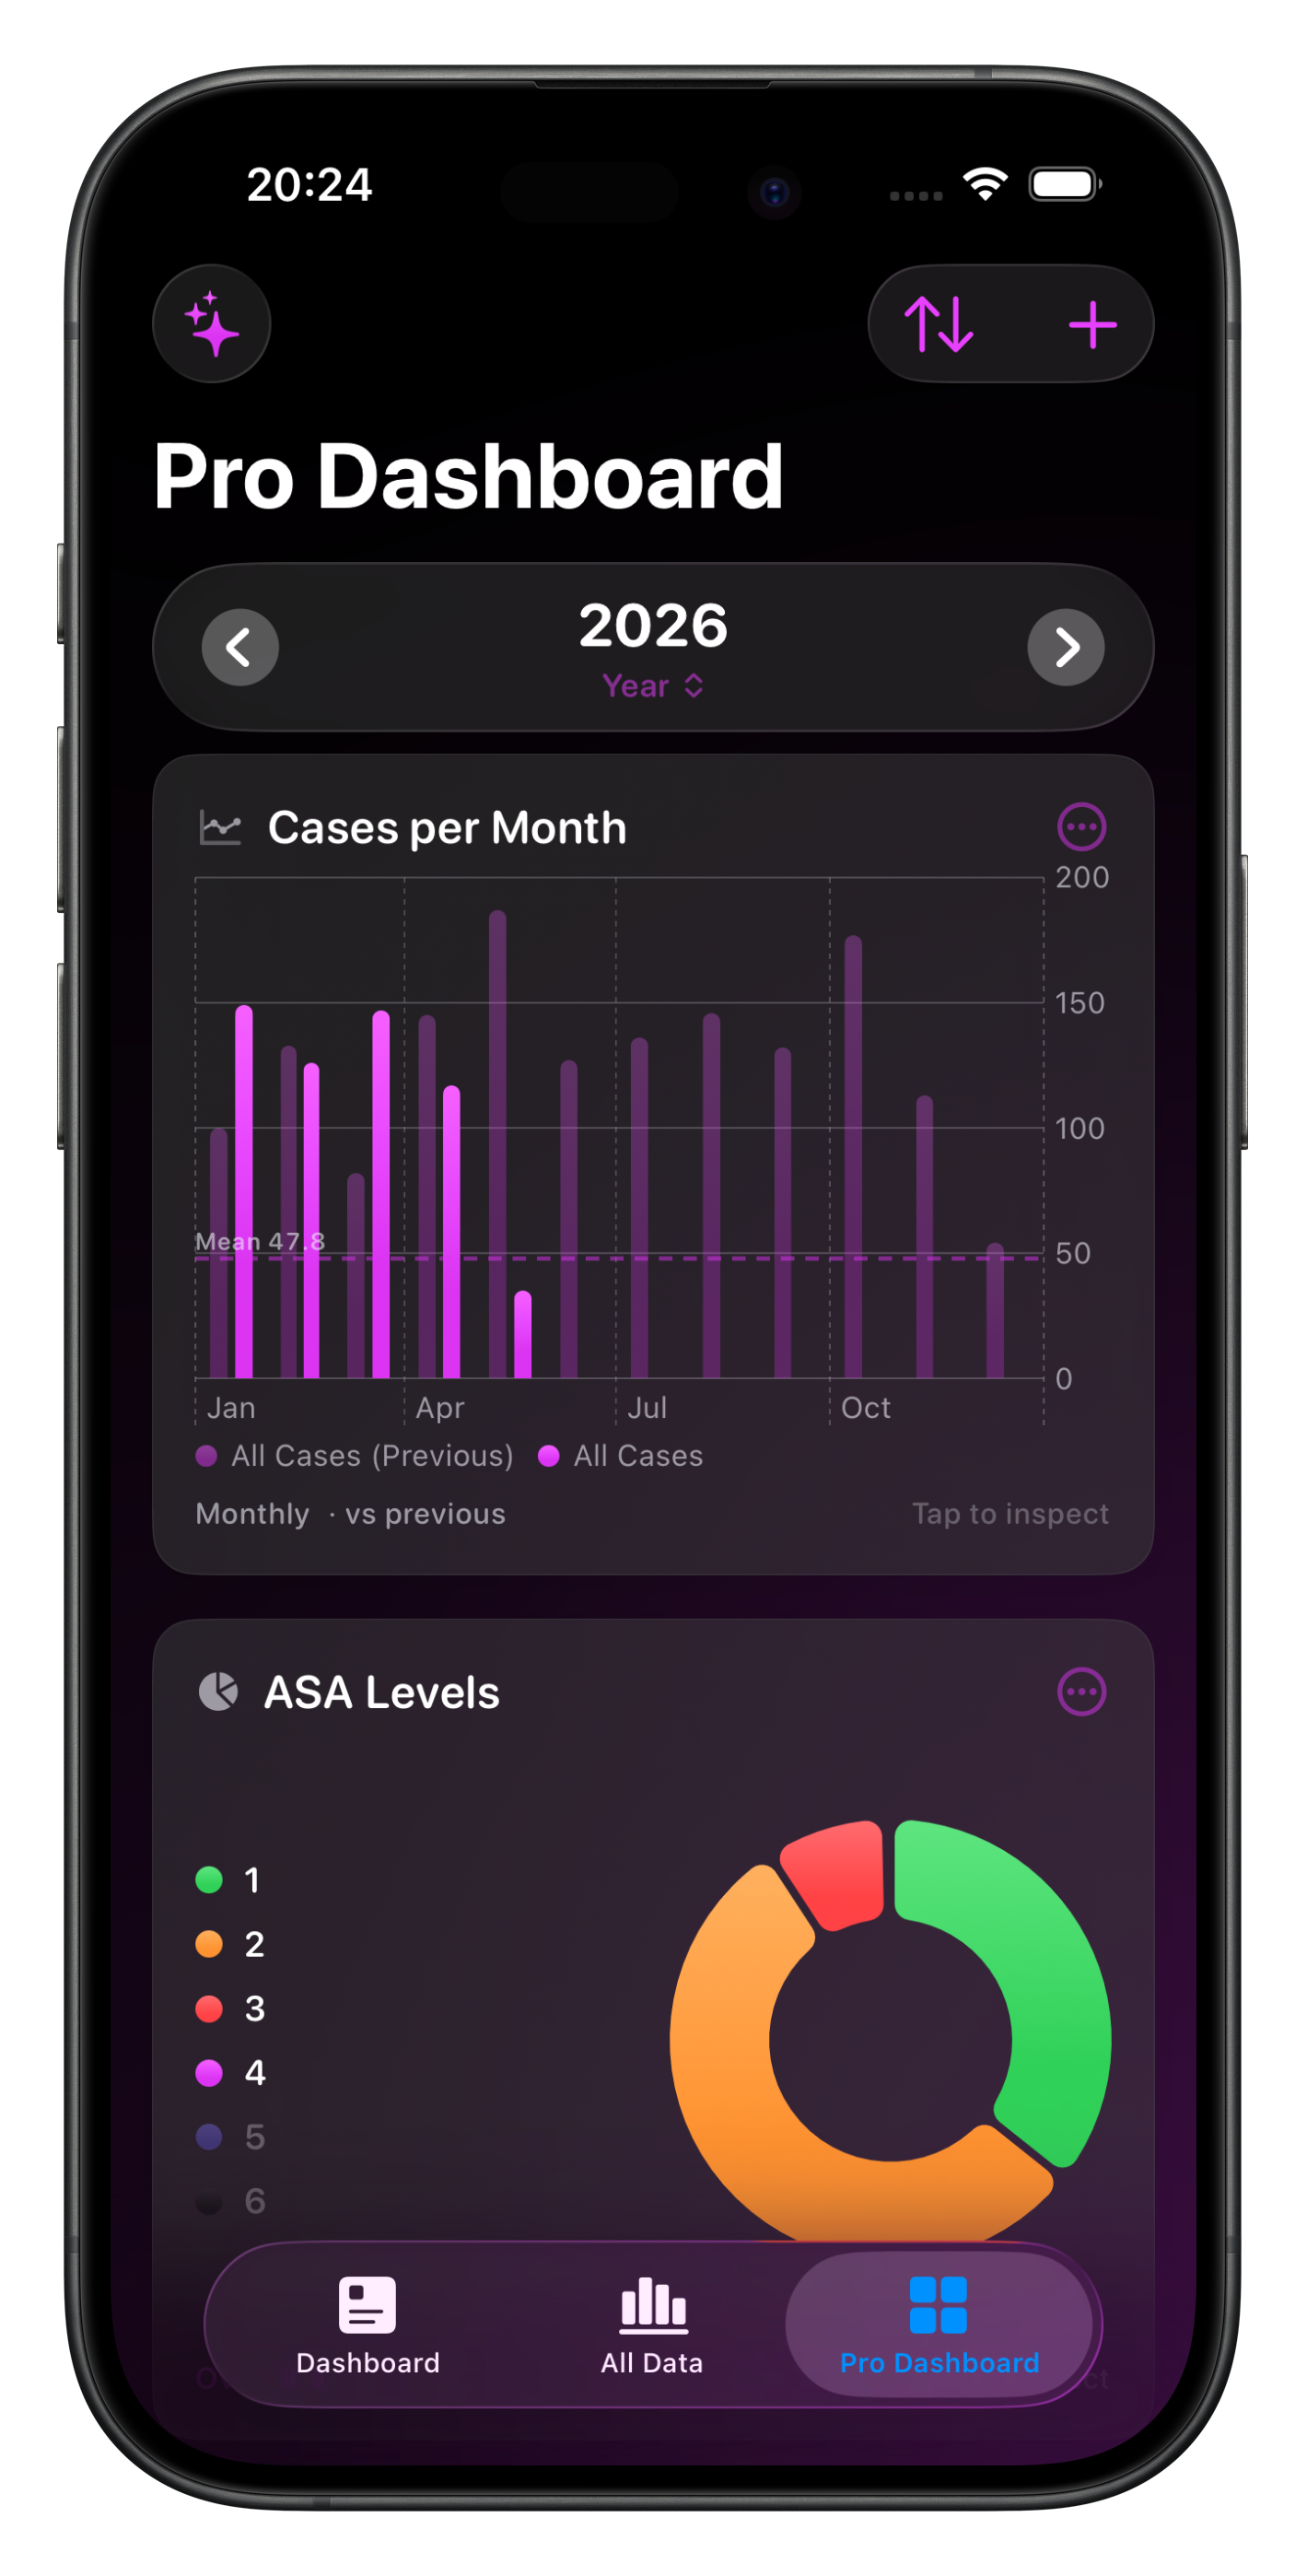
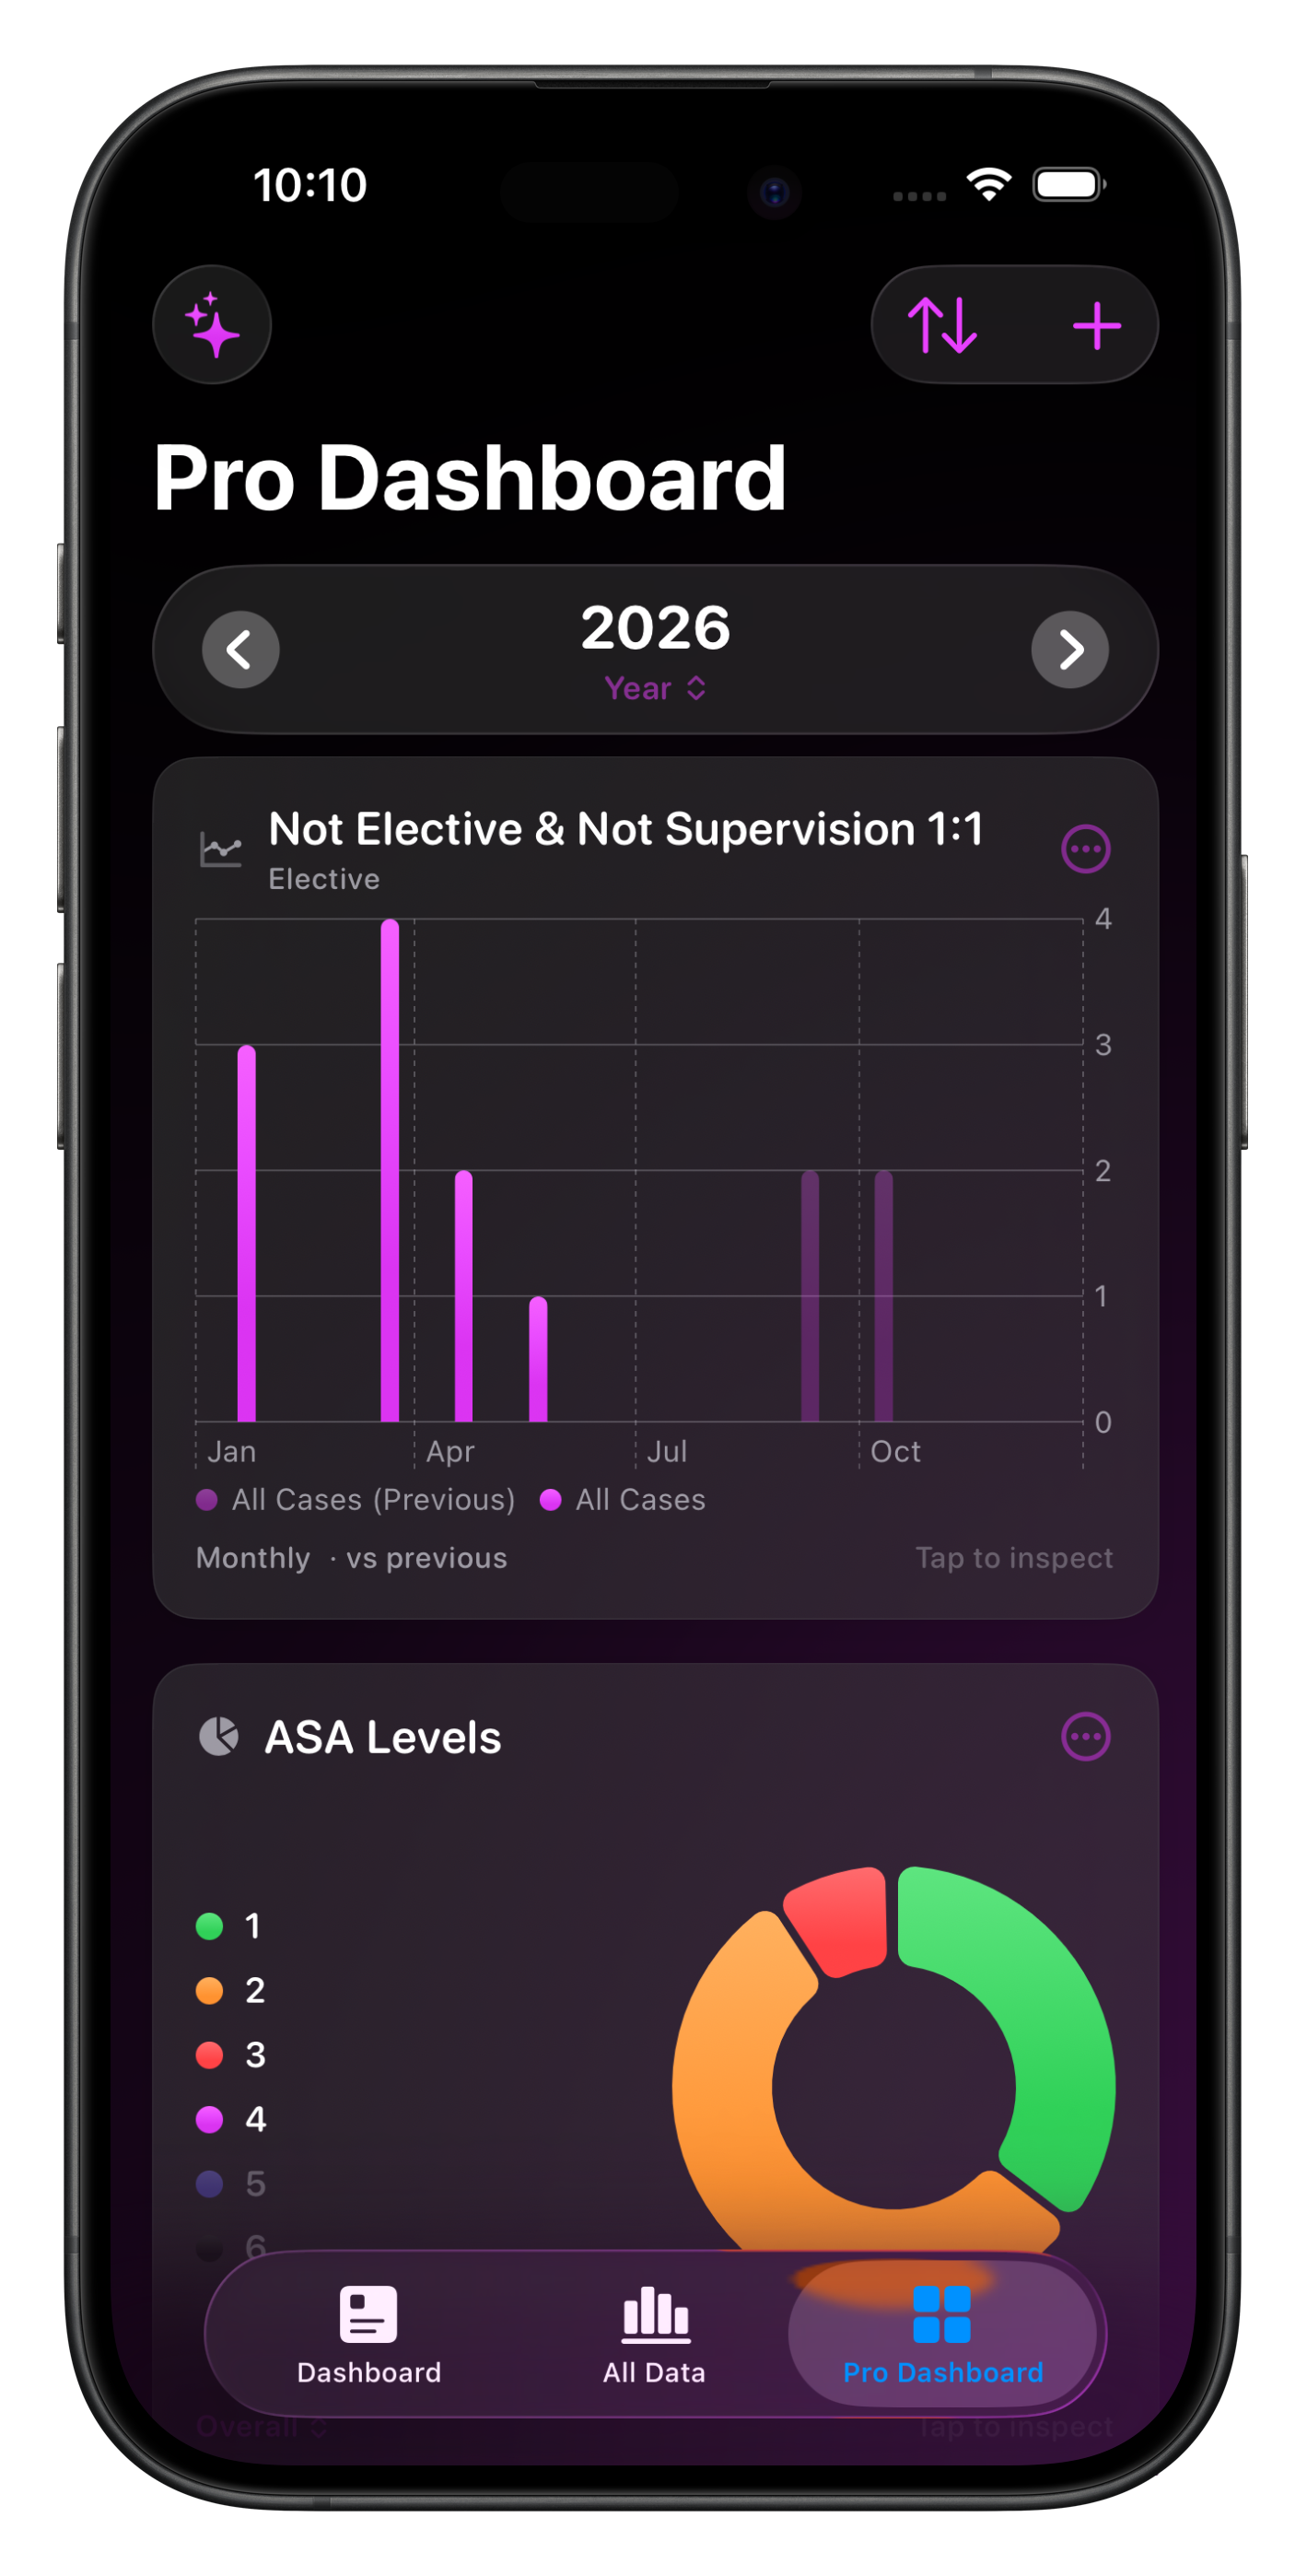
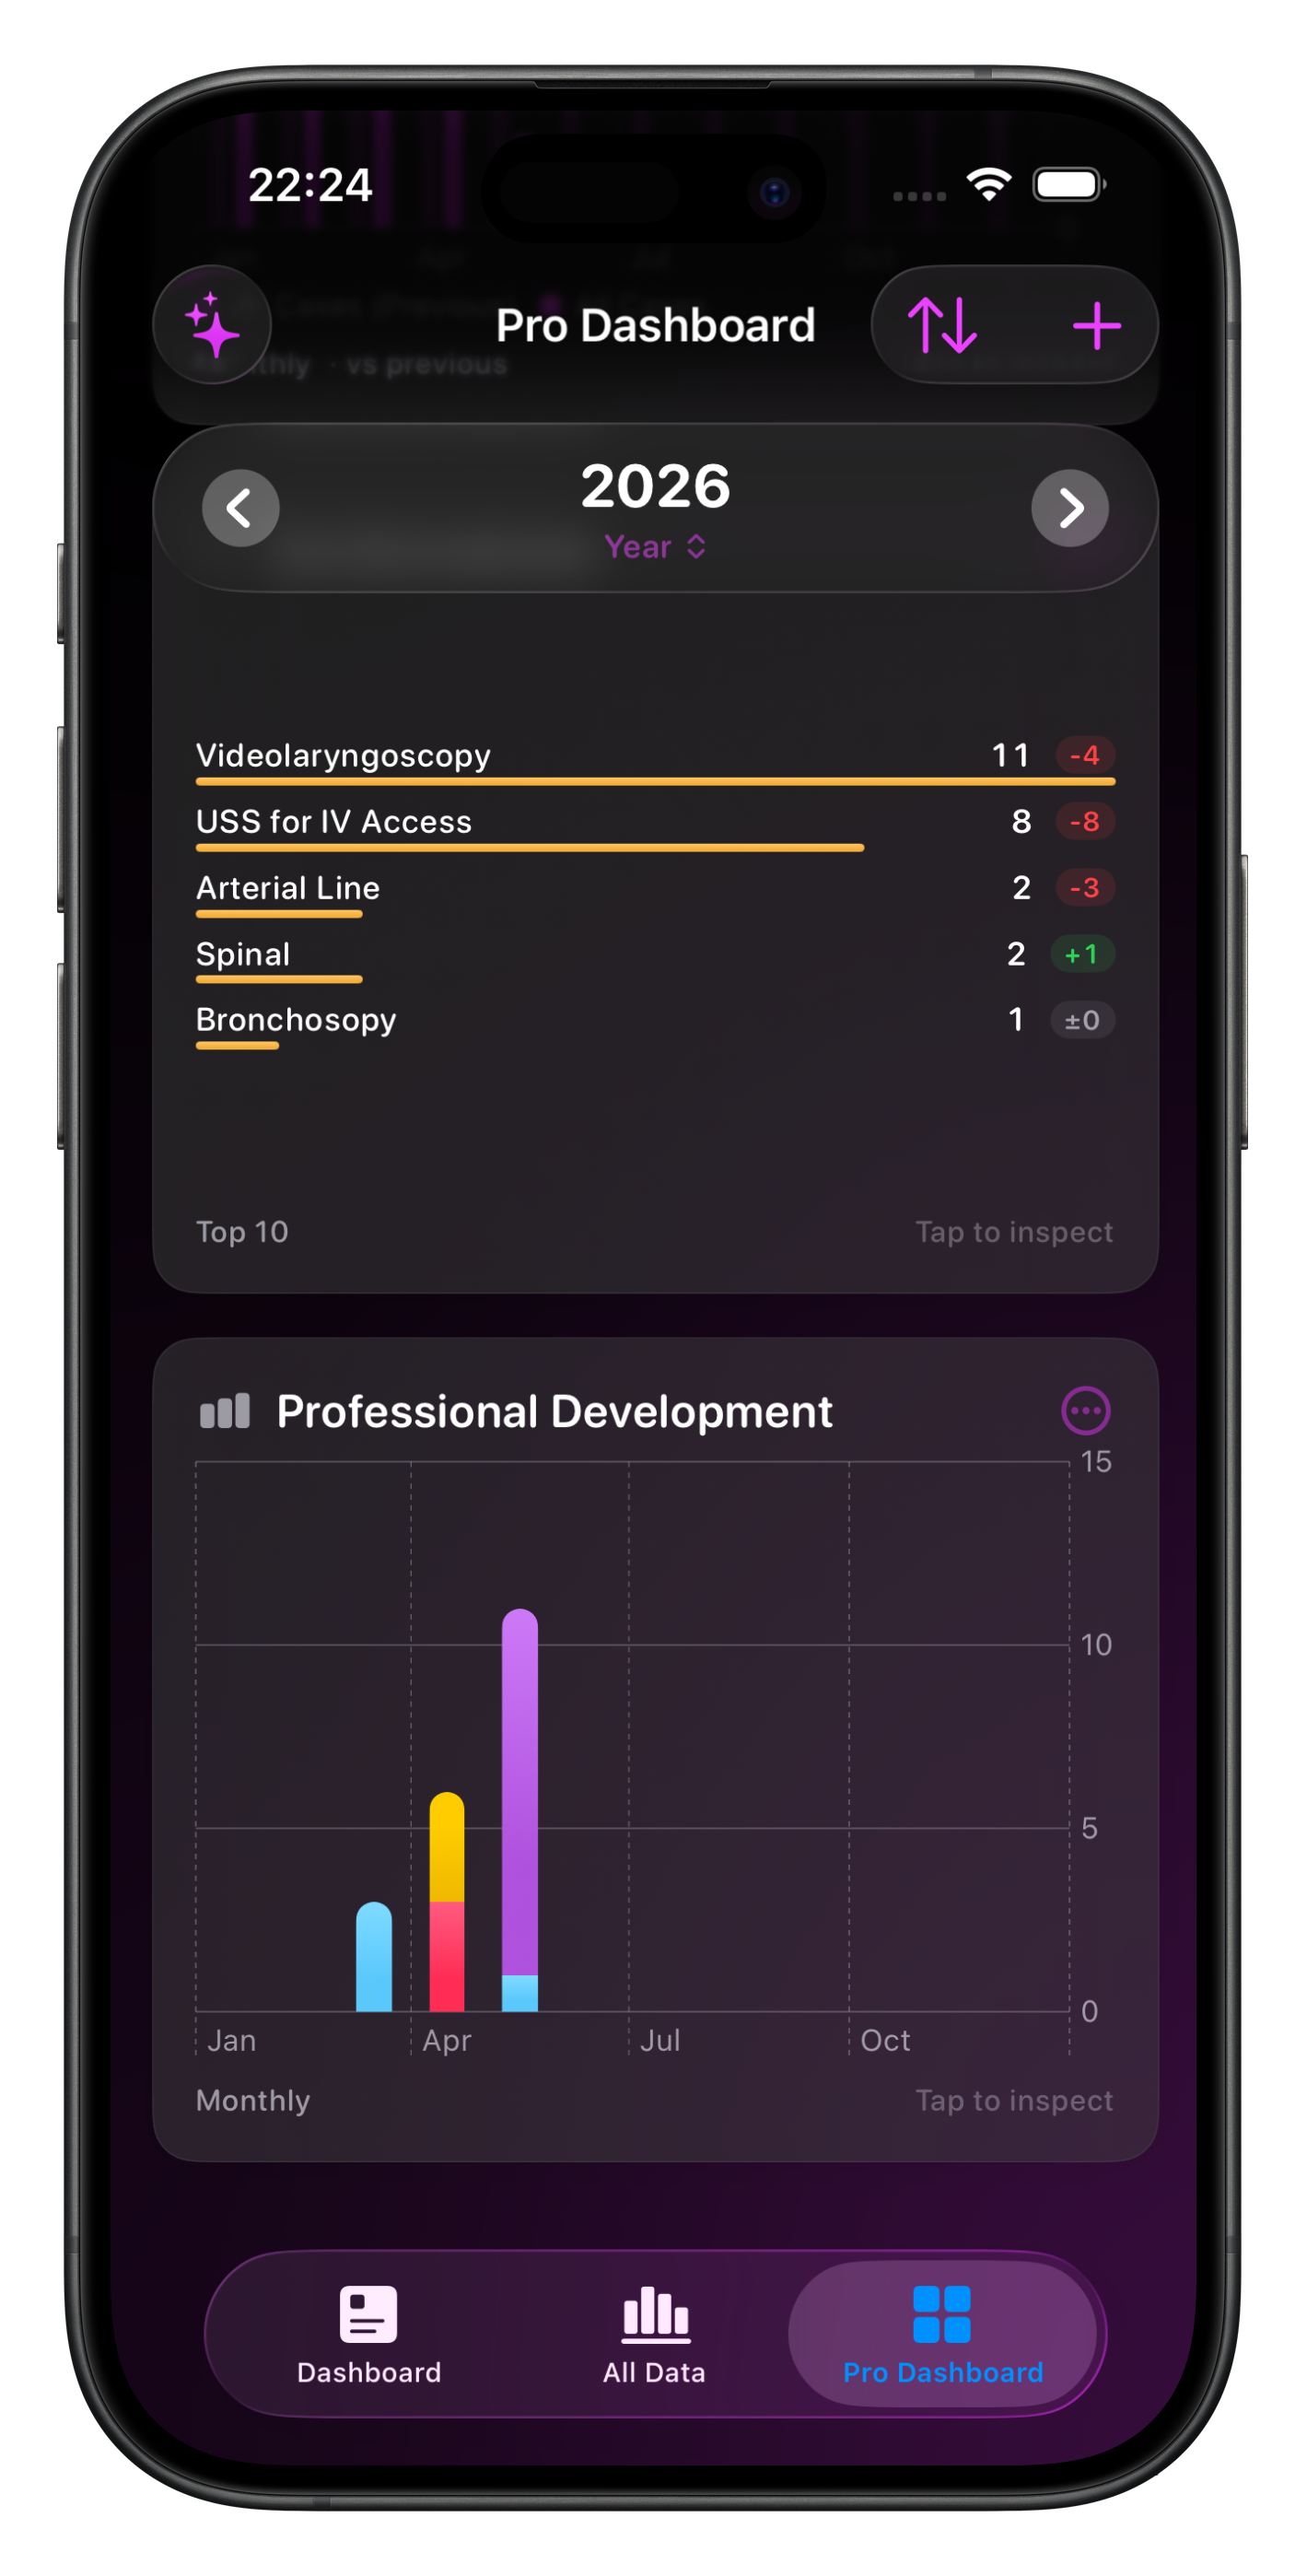
Pro Dashboard
The Pro Dashboard is a customisable, tile-based summary of your practice available to Pro subscribers.
The starter pack covers the basics, and the "+" button in the toolbar opens a picker for you to create charts that suit your needs.
A floating period header at the top lets you flip between week, month, quarter, year, or all-time - every tile re-renders for the new window in one tap.
Step forward and backward through historical periods to compare this month against last, this year against the year before, all without leaving the Dashboard.
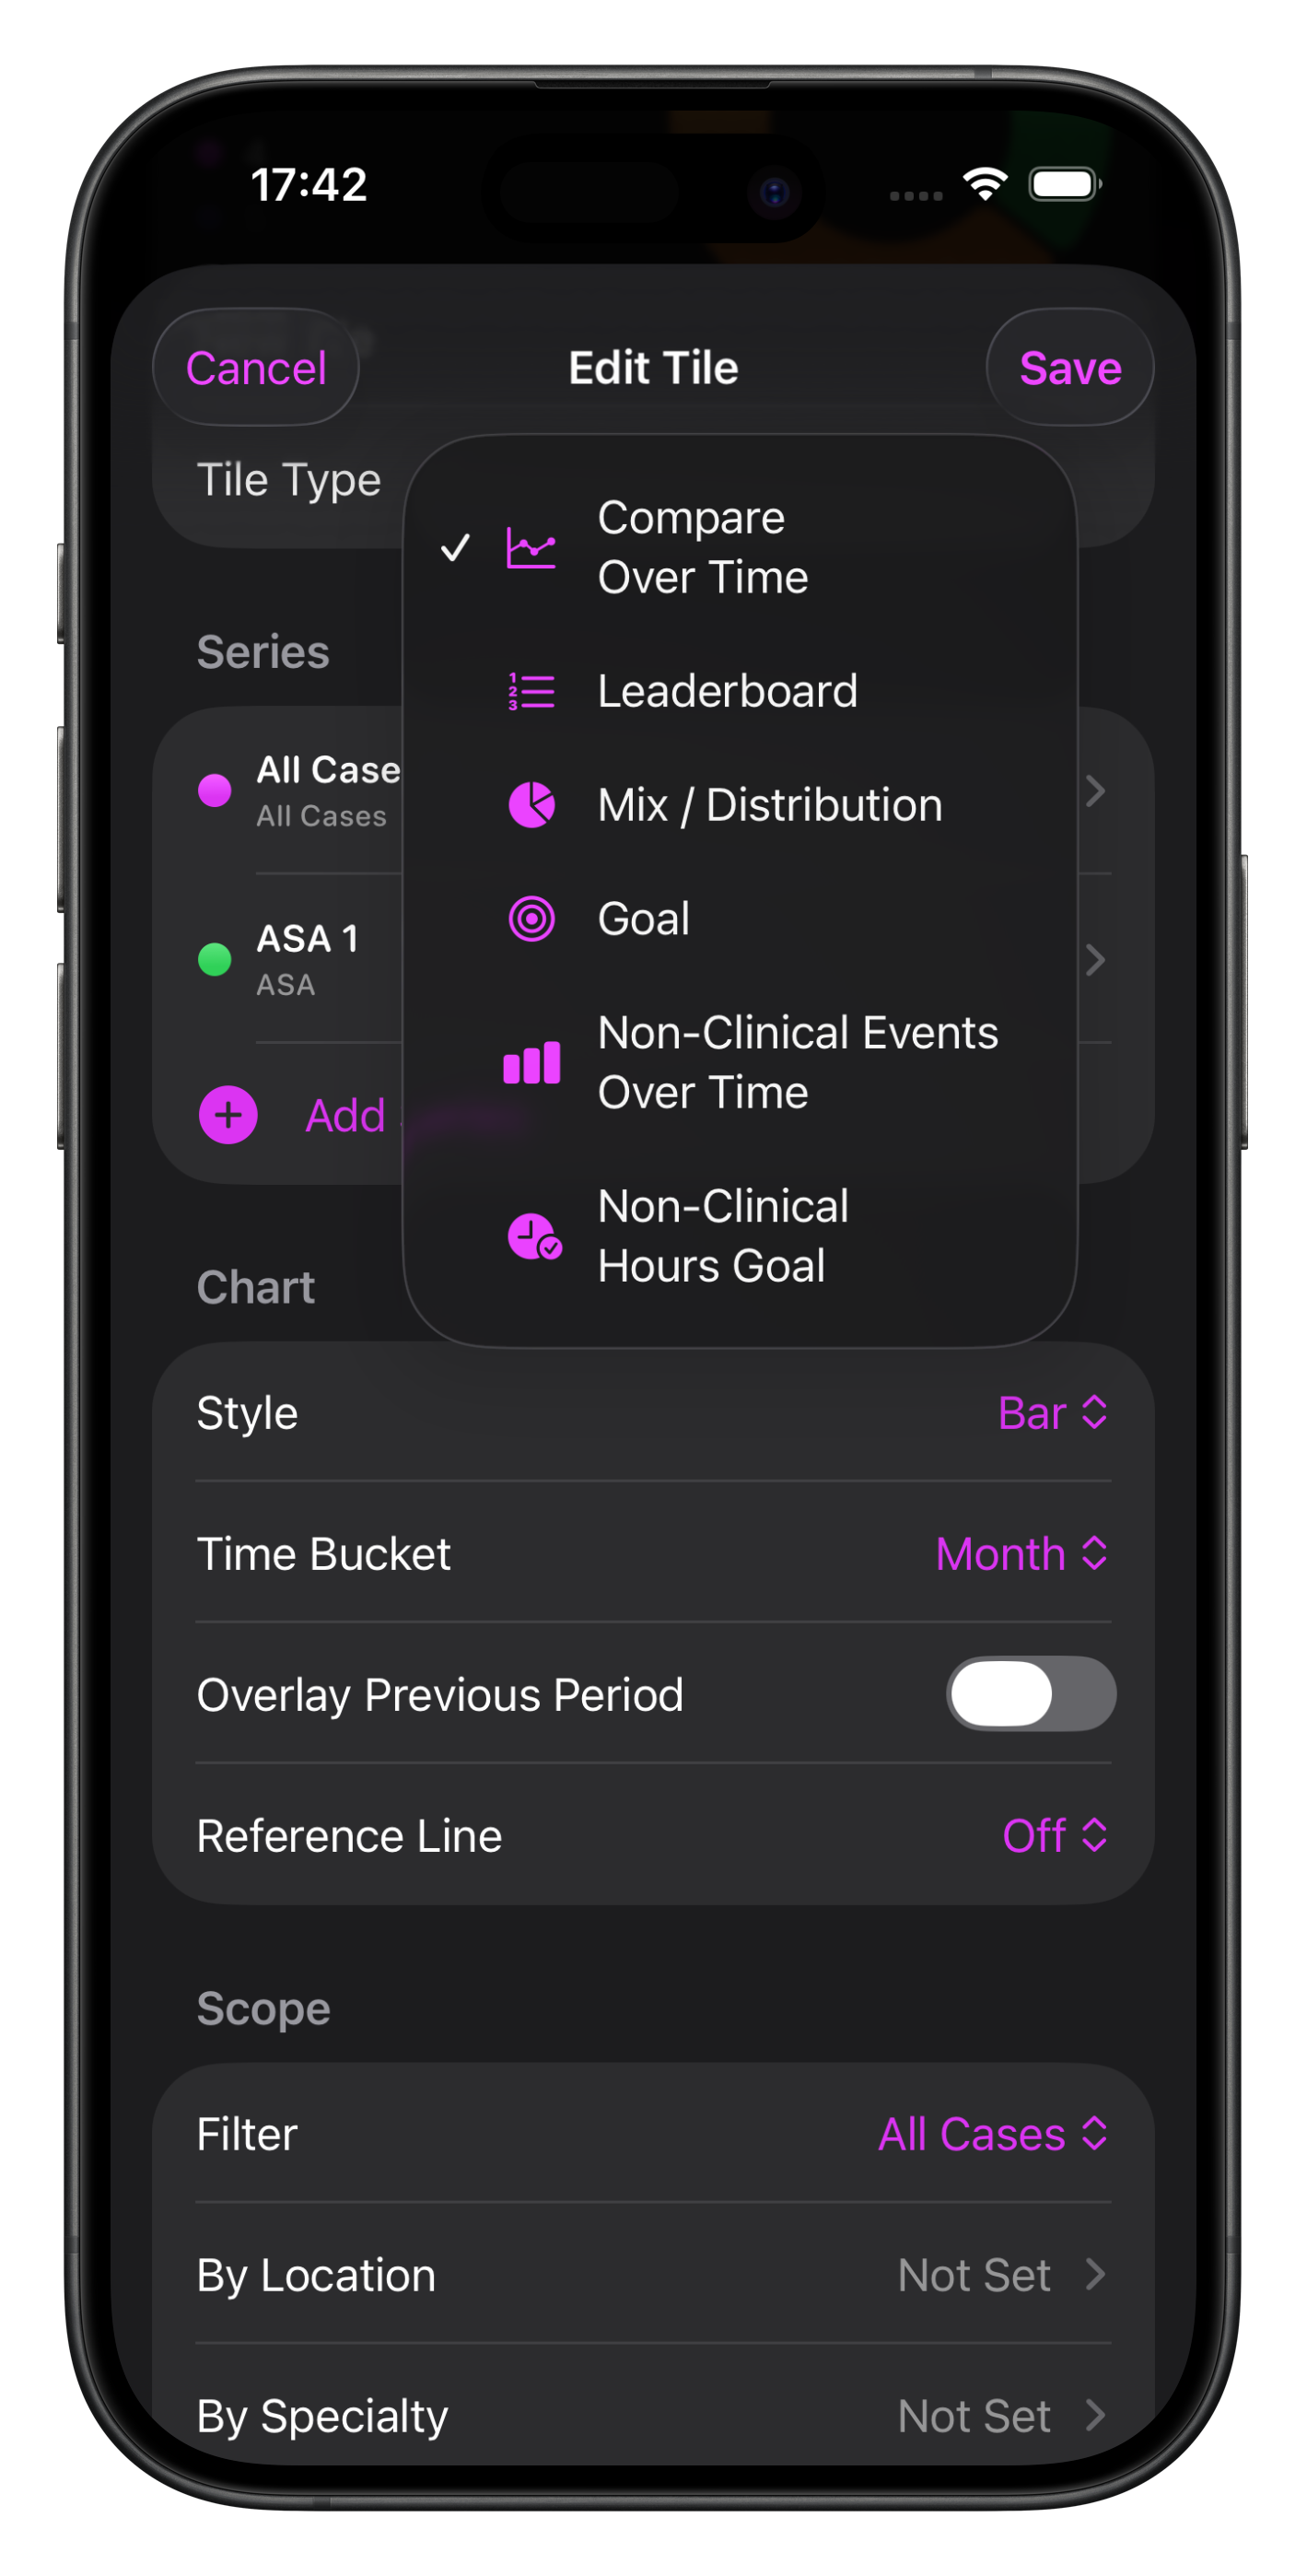
There are 4 charts to choose from for Cases:
And 2 charts to choose from for Non-Clinical Events:
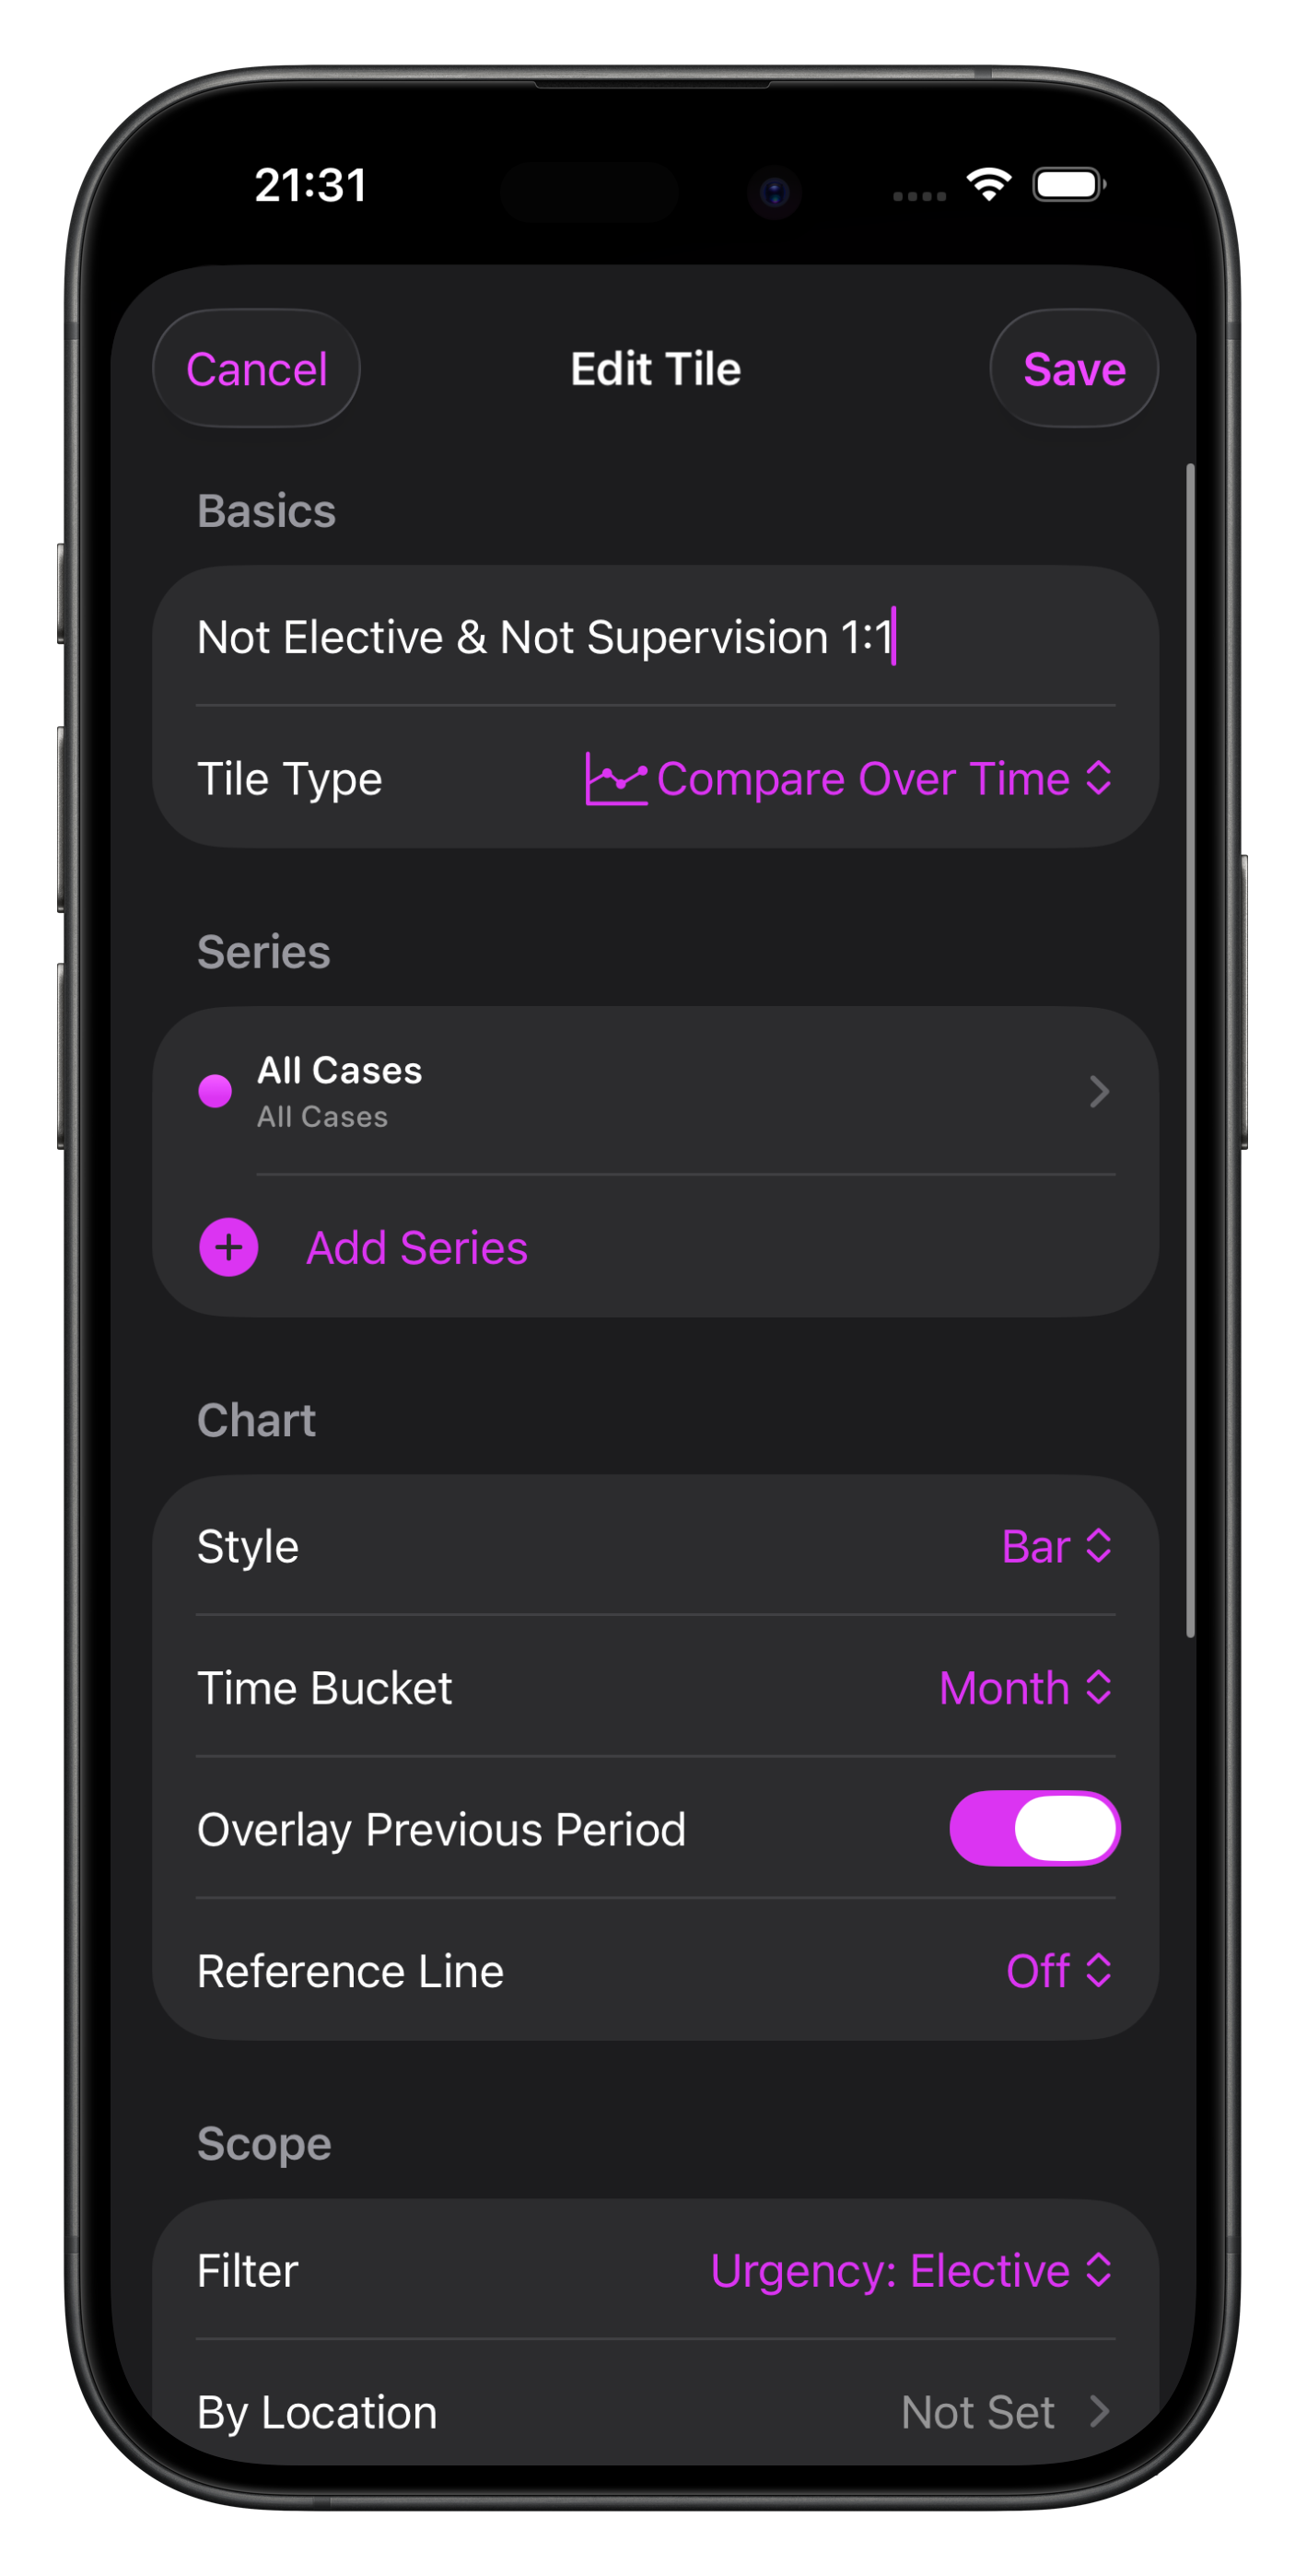
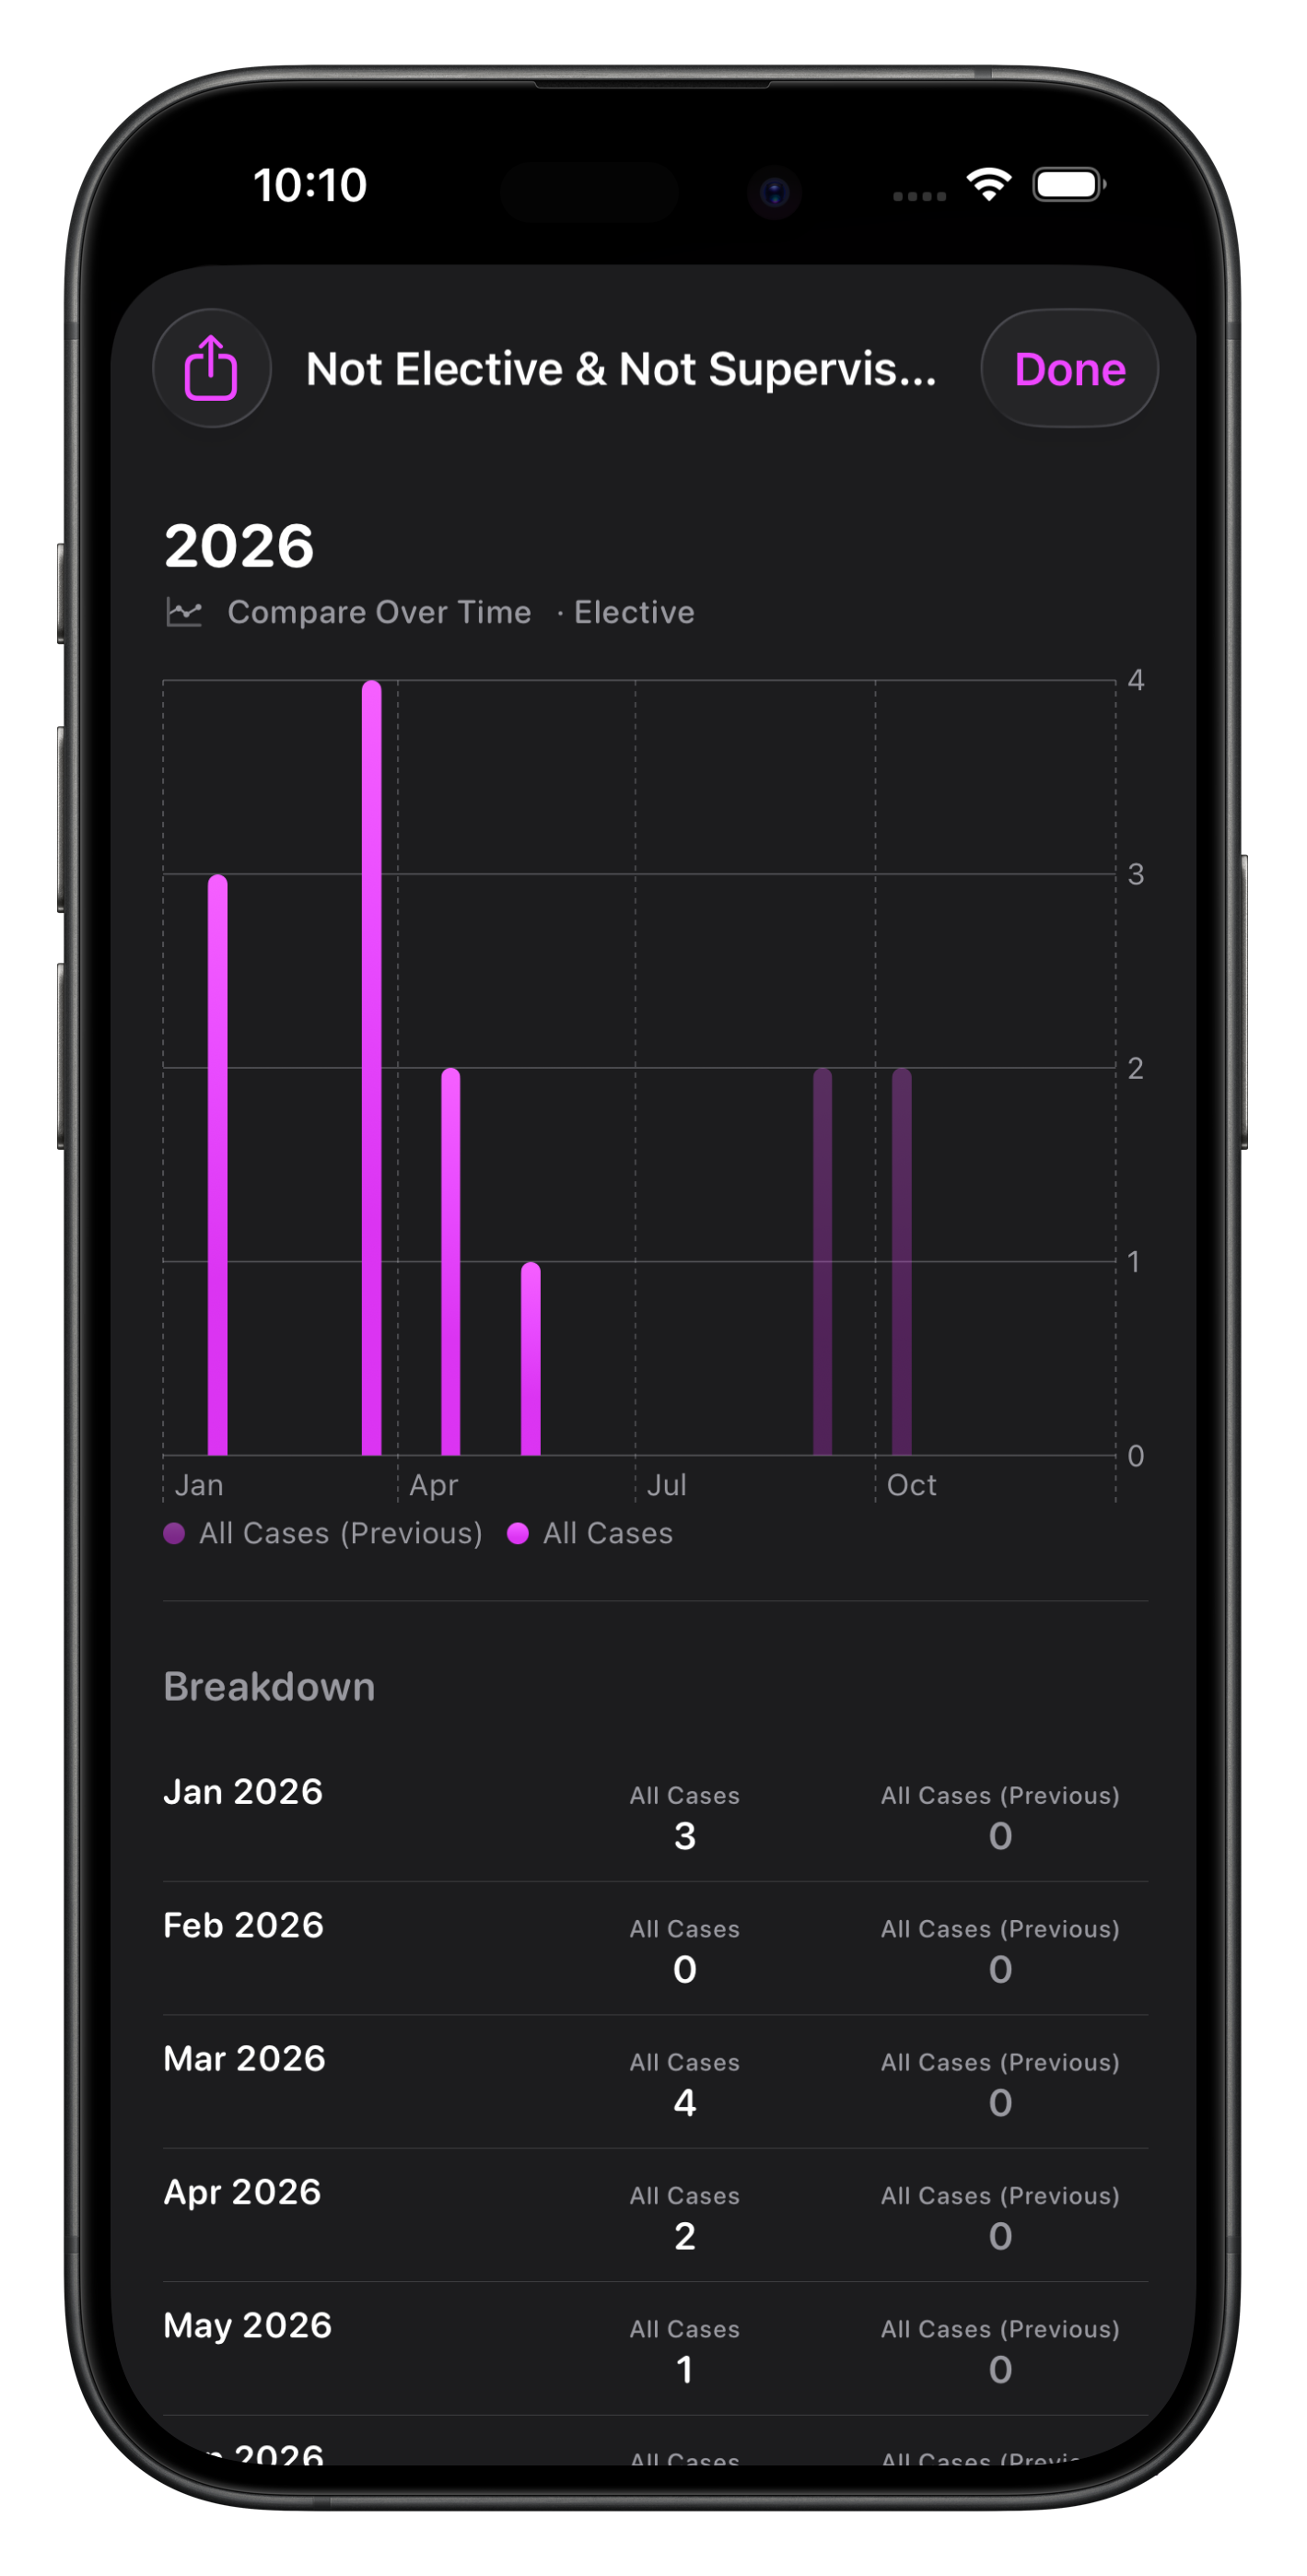
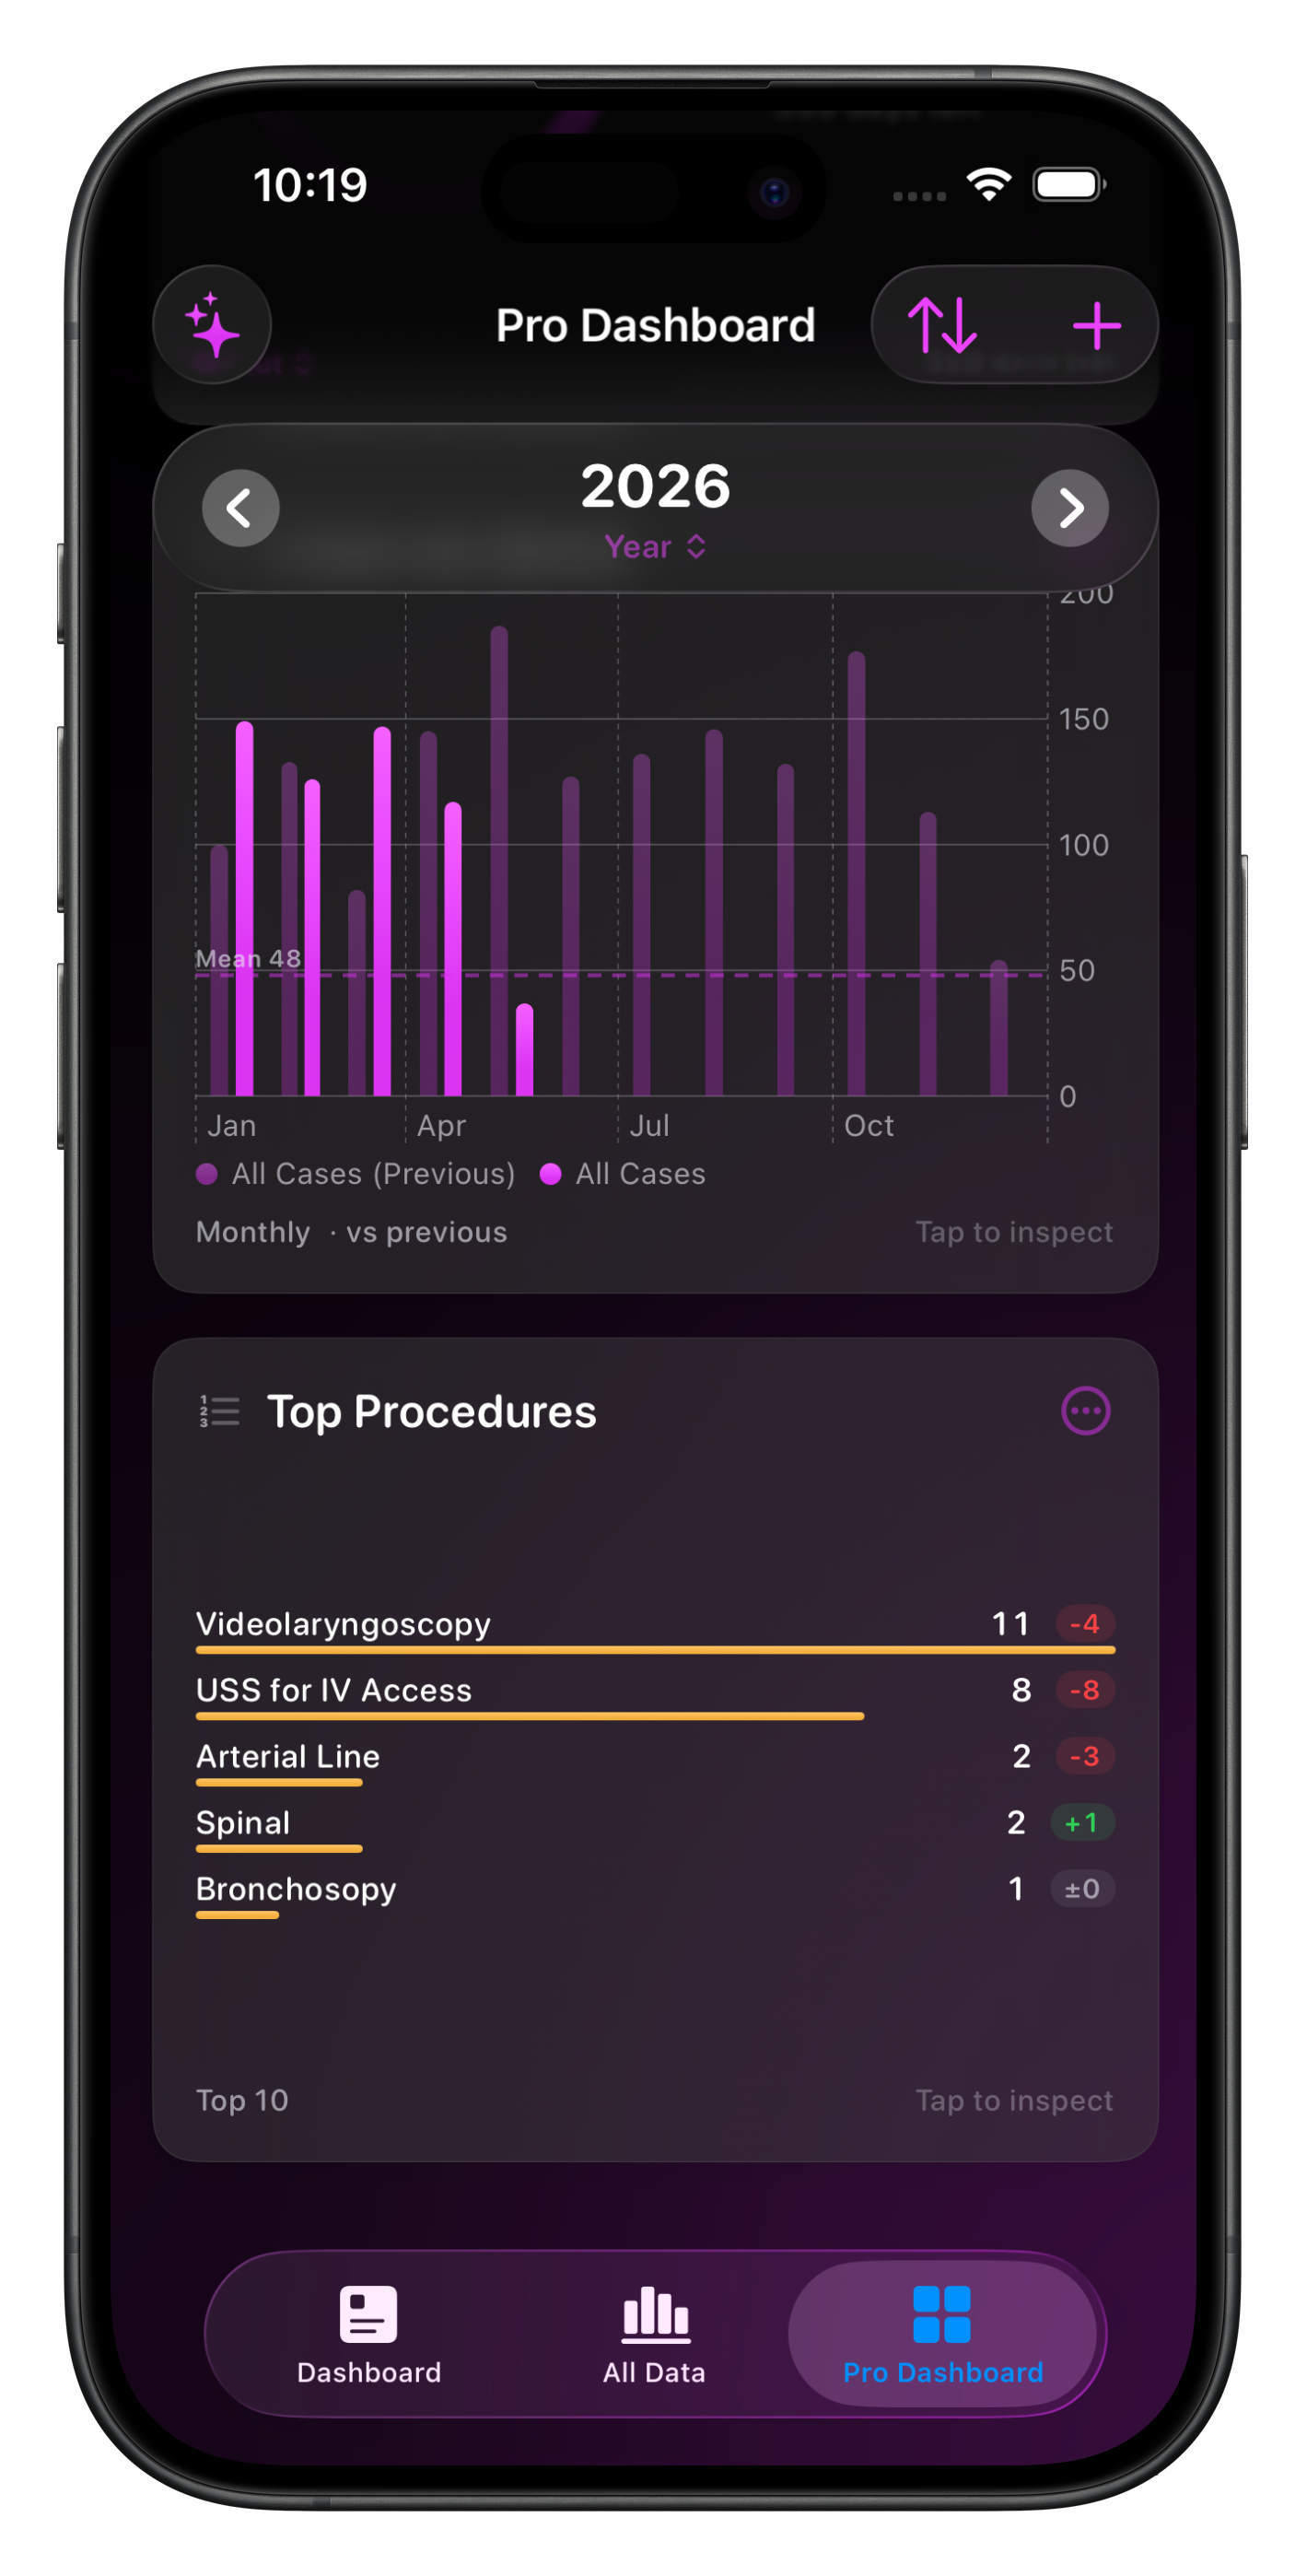
Compare Over Time
This chart tile allows you to compare Cases from up to 4 series over time, charted as either a bar, line or stacked area chart.
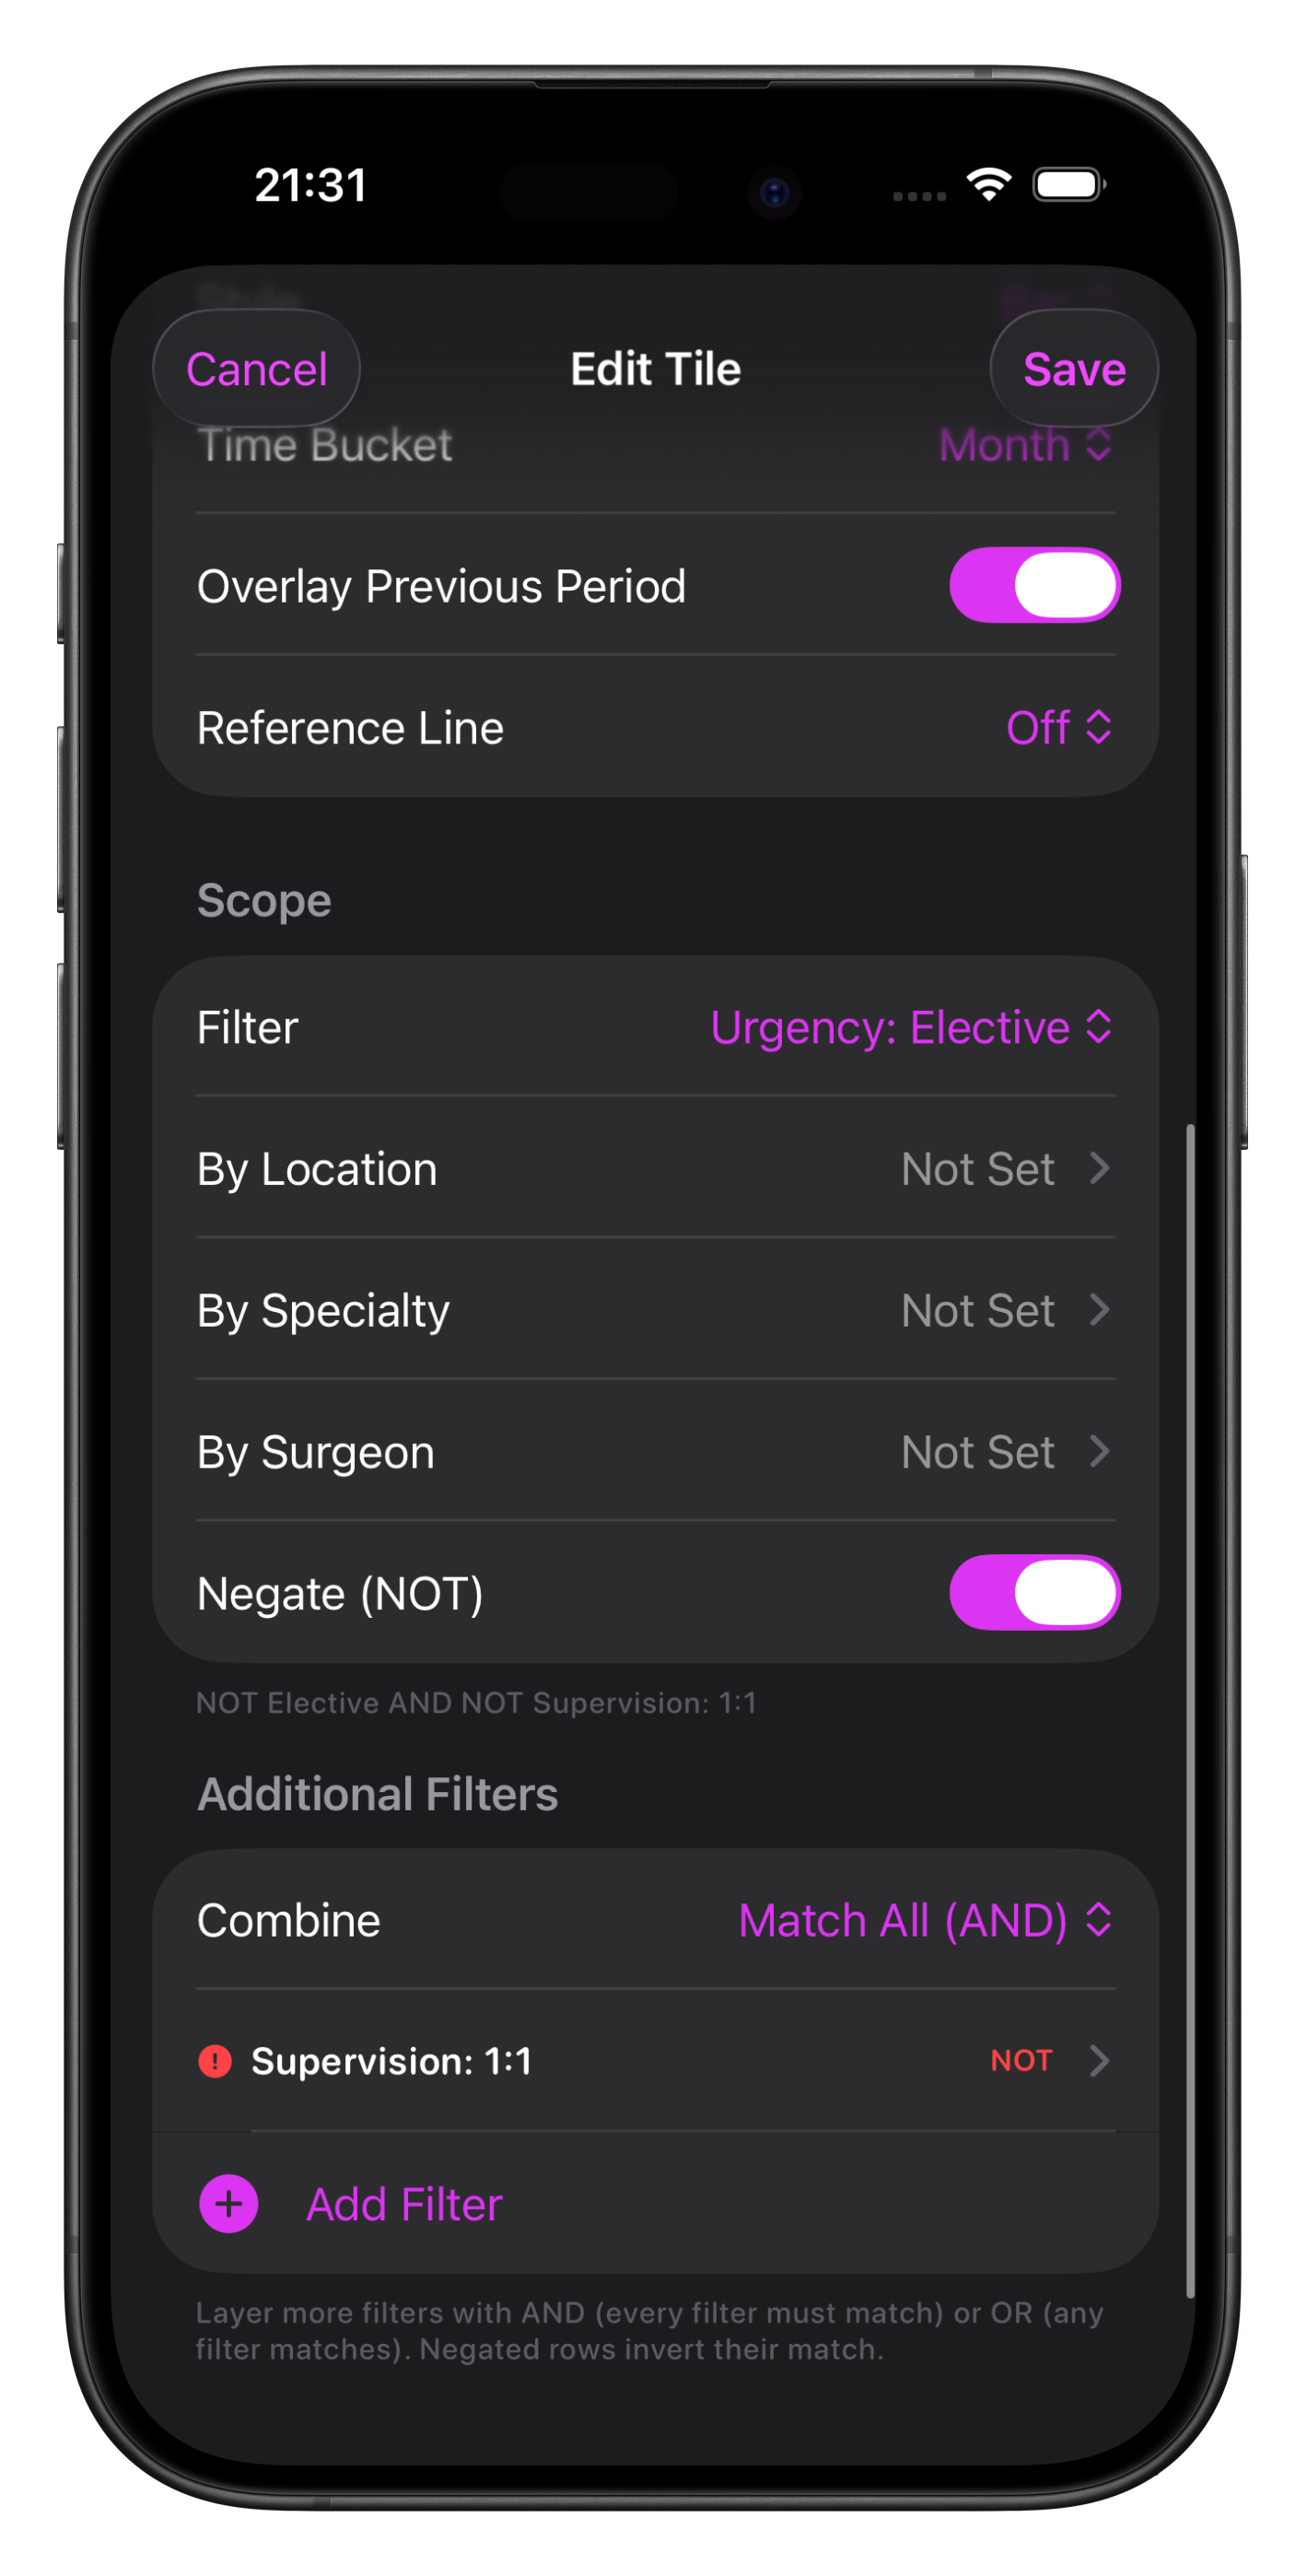
Customise series colours & labels and choose the time bucket for display on the x-axis. Optionally overlay the previous period (based on the Dashboard period displayed) and reference lines (mean and/or median).
You can adjust the scope filters & add additional filters for fine grained analysis including specifying inclusions or exclusions.
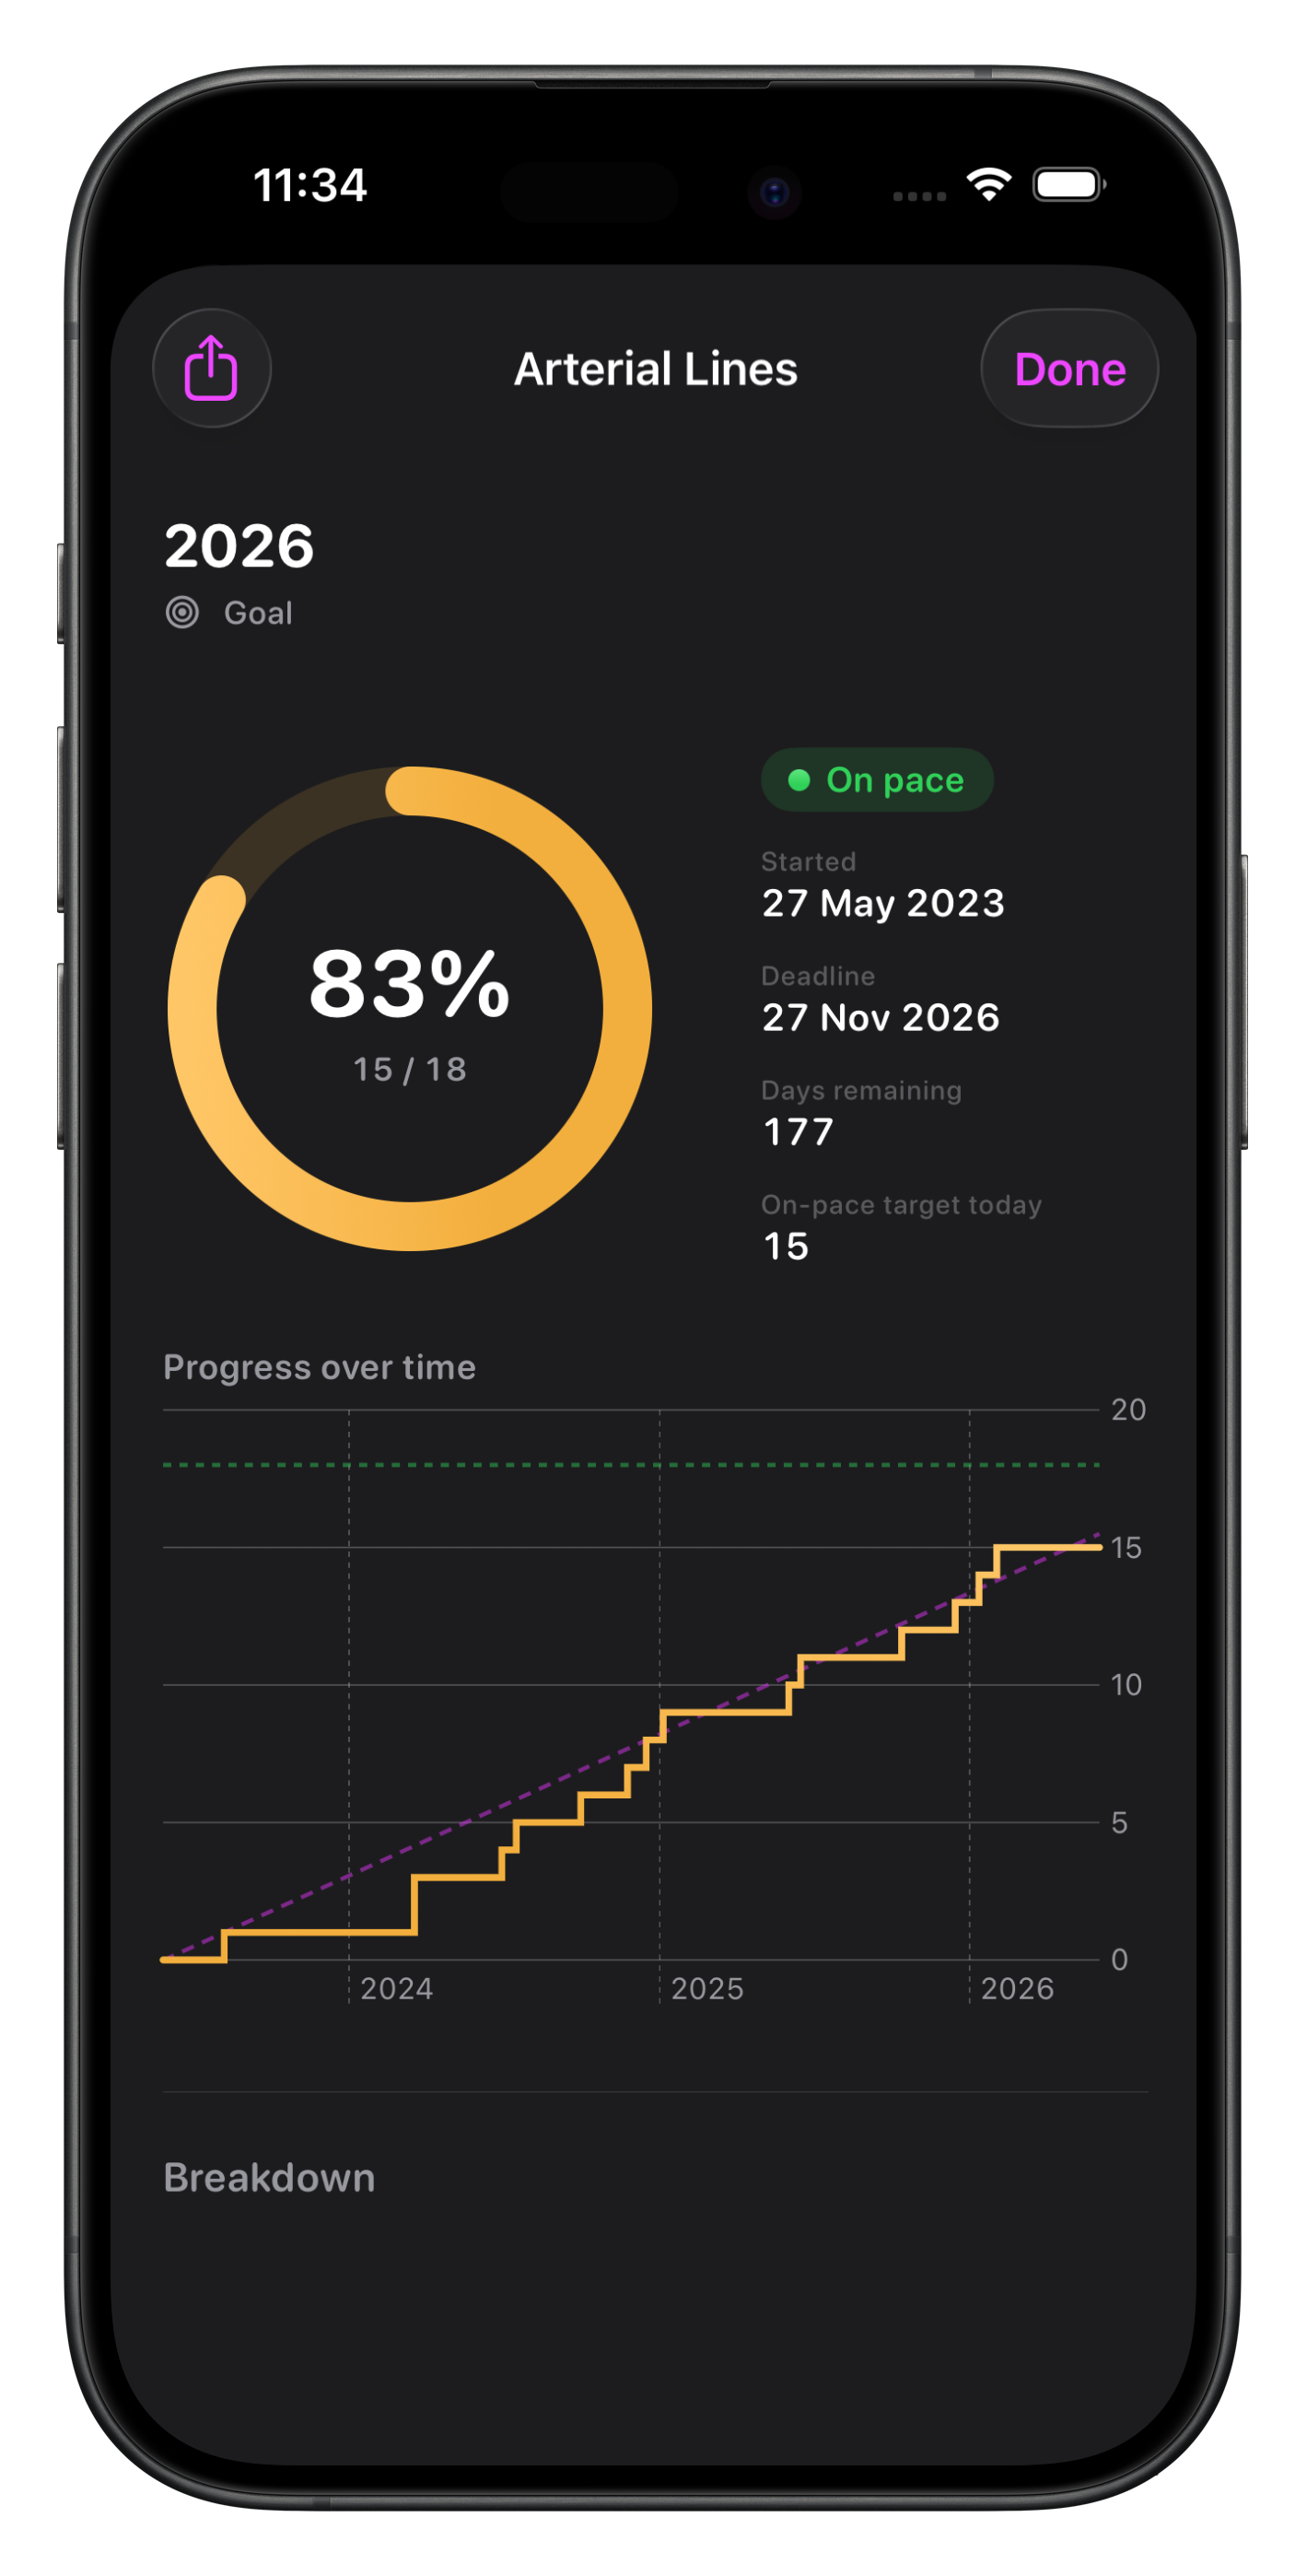
To export a chart as an image, use the context menu and to see more detail, including the ability to export all the captured Cases in one of Somnus’ many export formats, tap the chart tile .

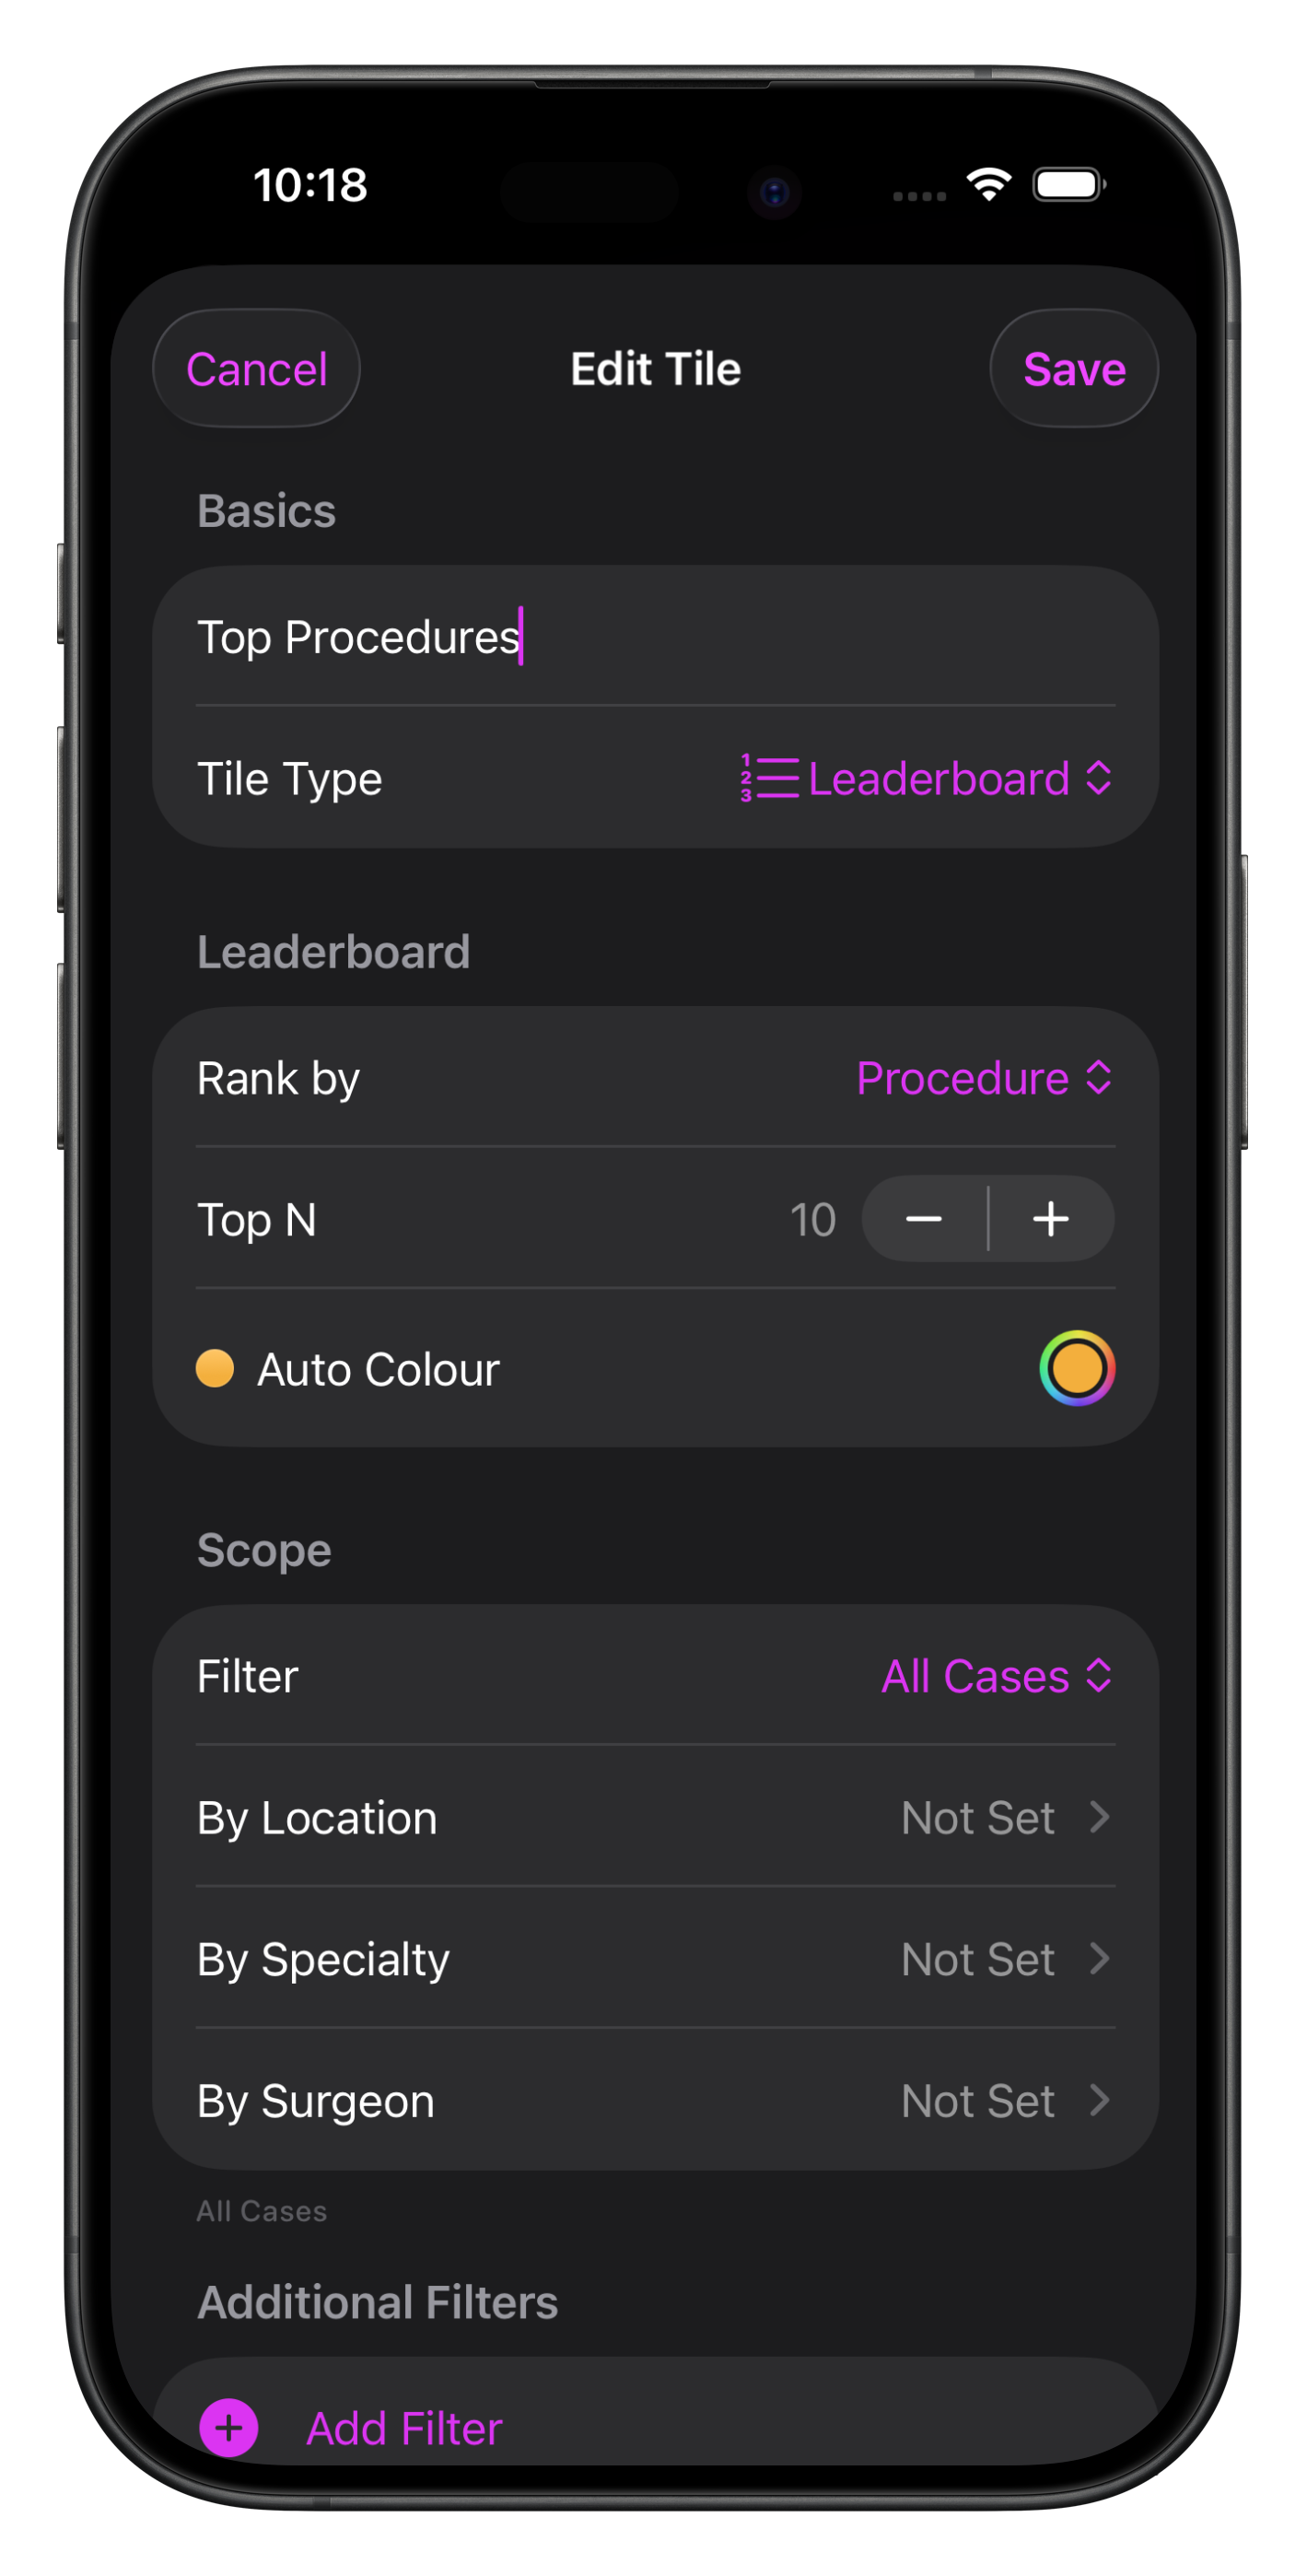
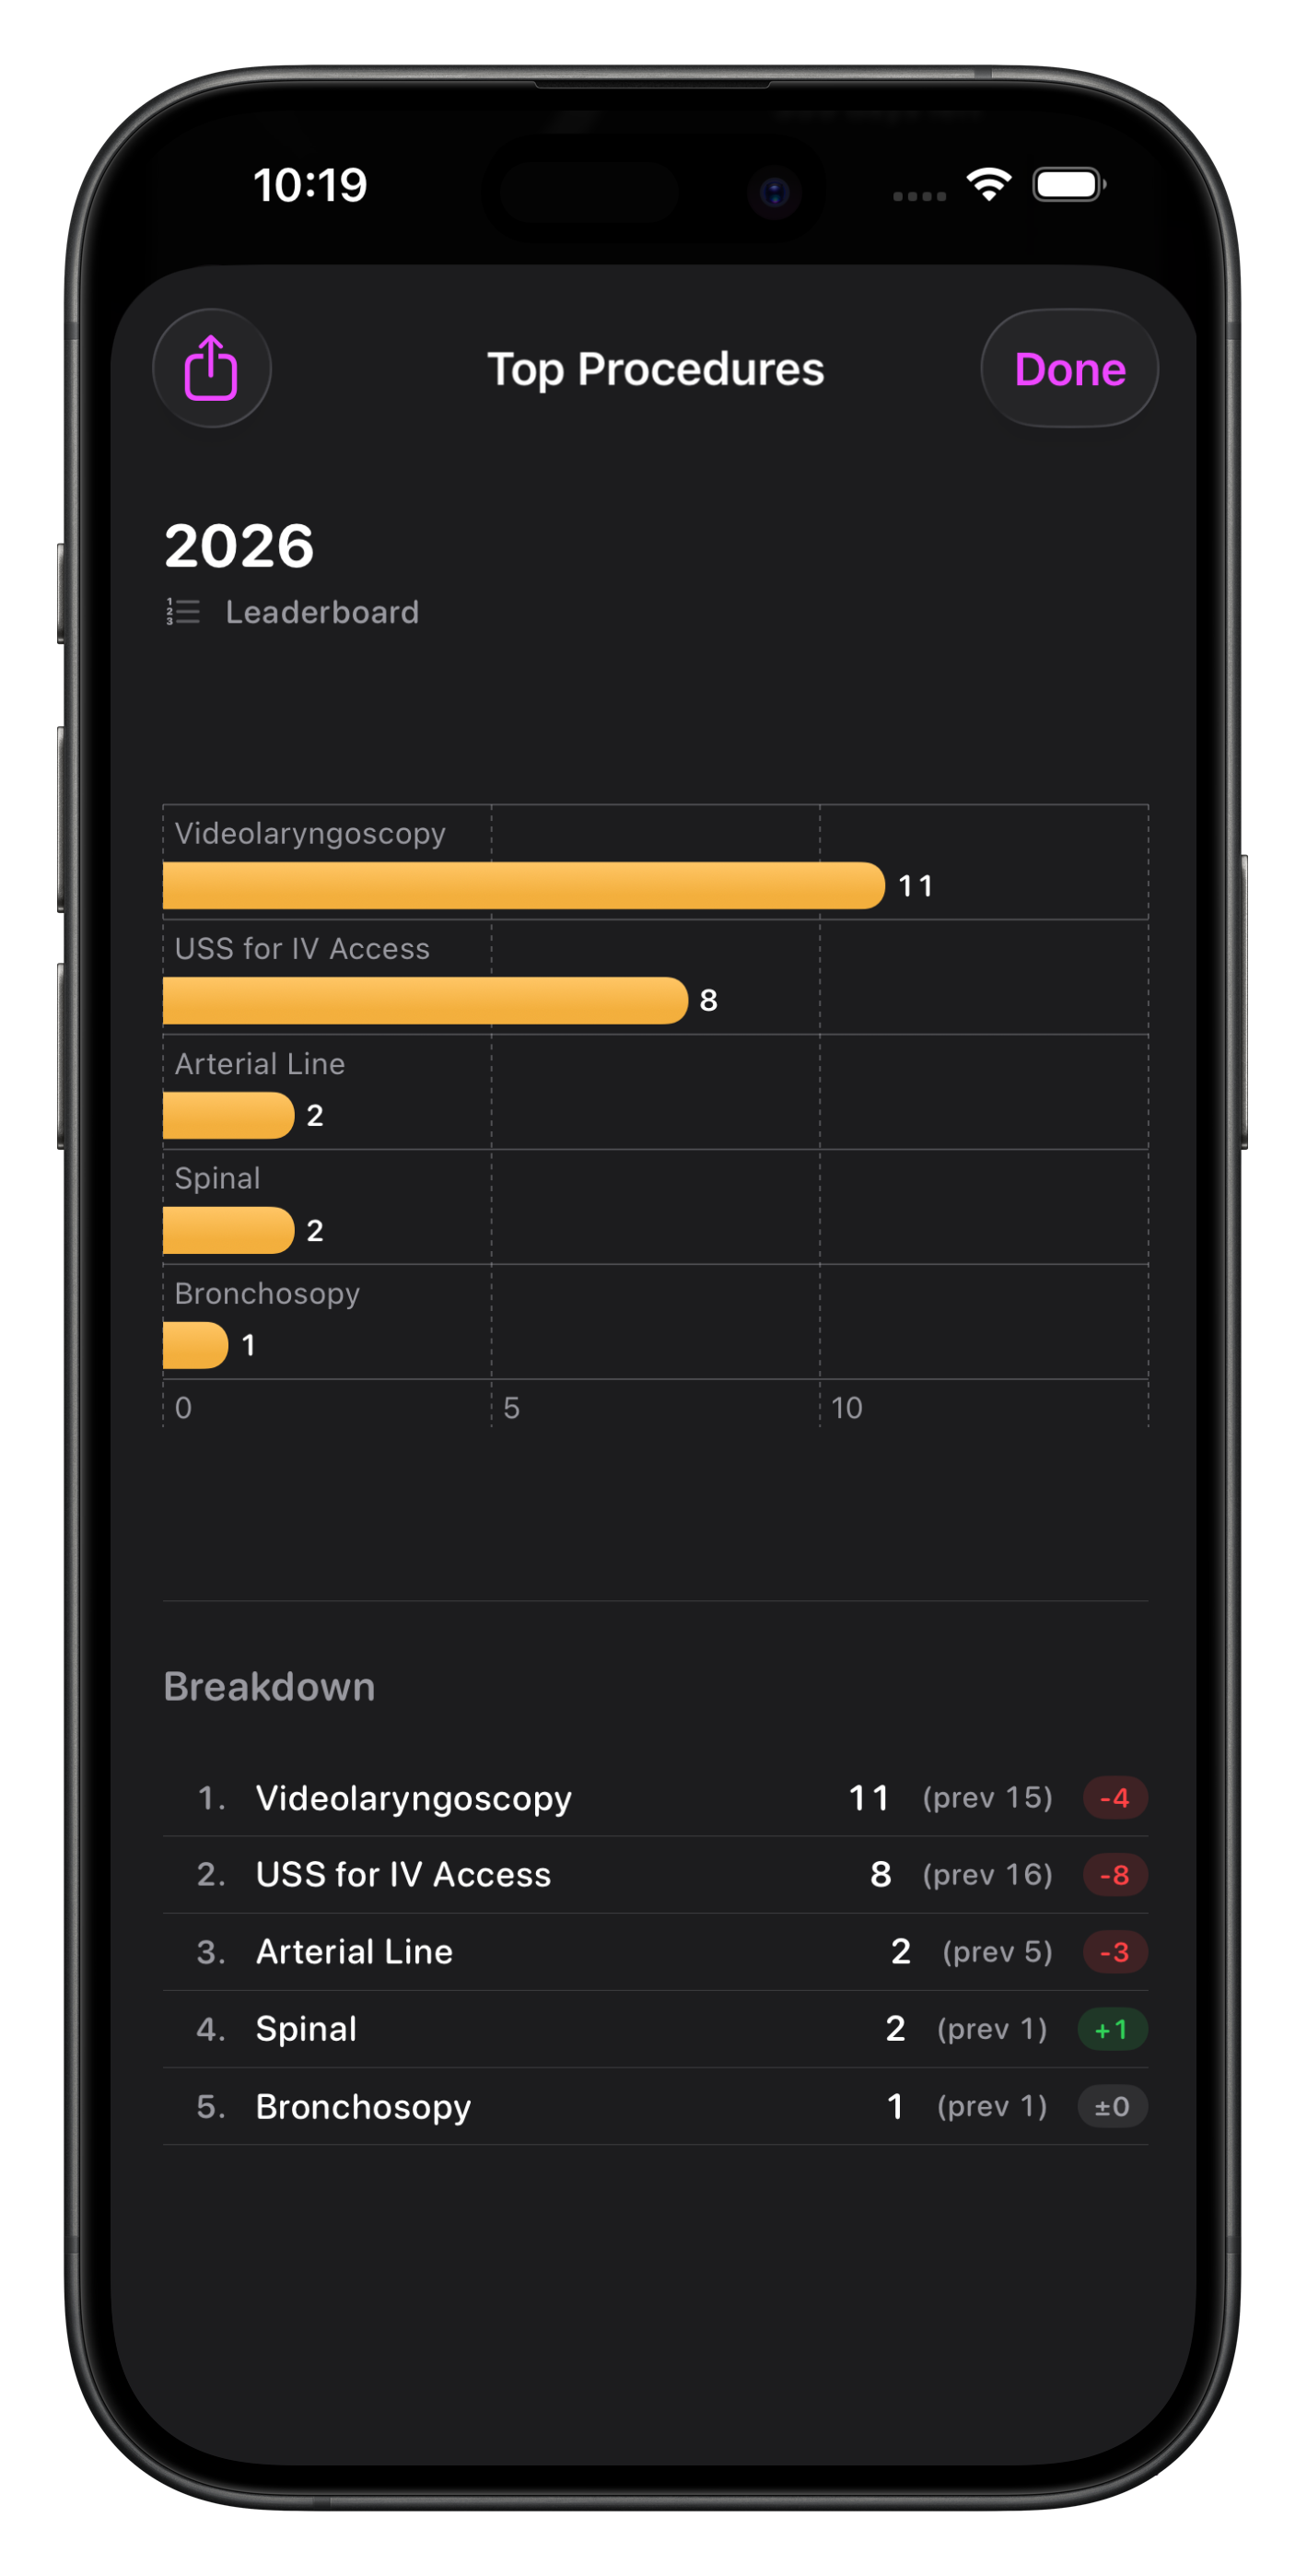
Leaderboard
This chart type allows you to list the top items (up to 30) by Case count from any category in Somnus, including your Personal List Items.
Filtering options are similar to those for other chart types, including the ability to include/exclude categories.

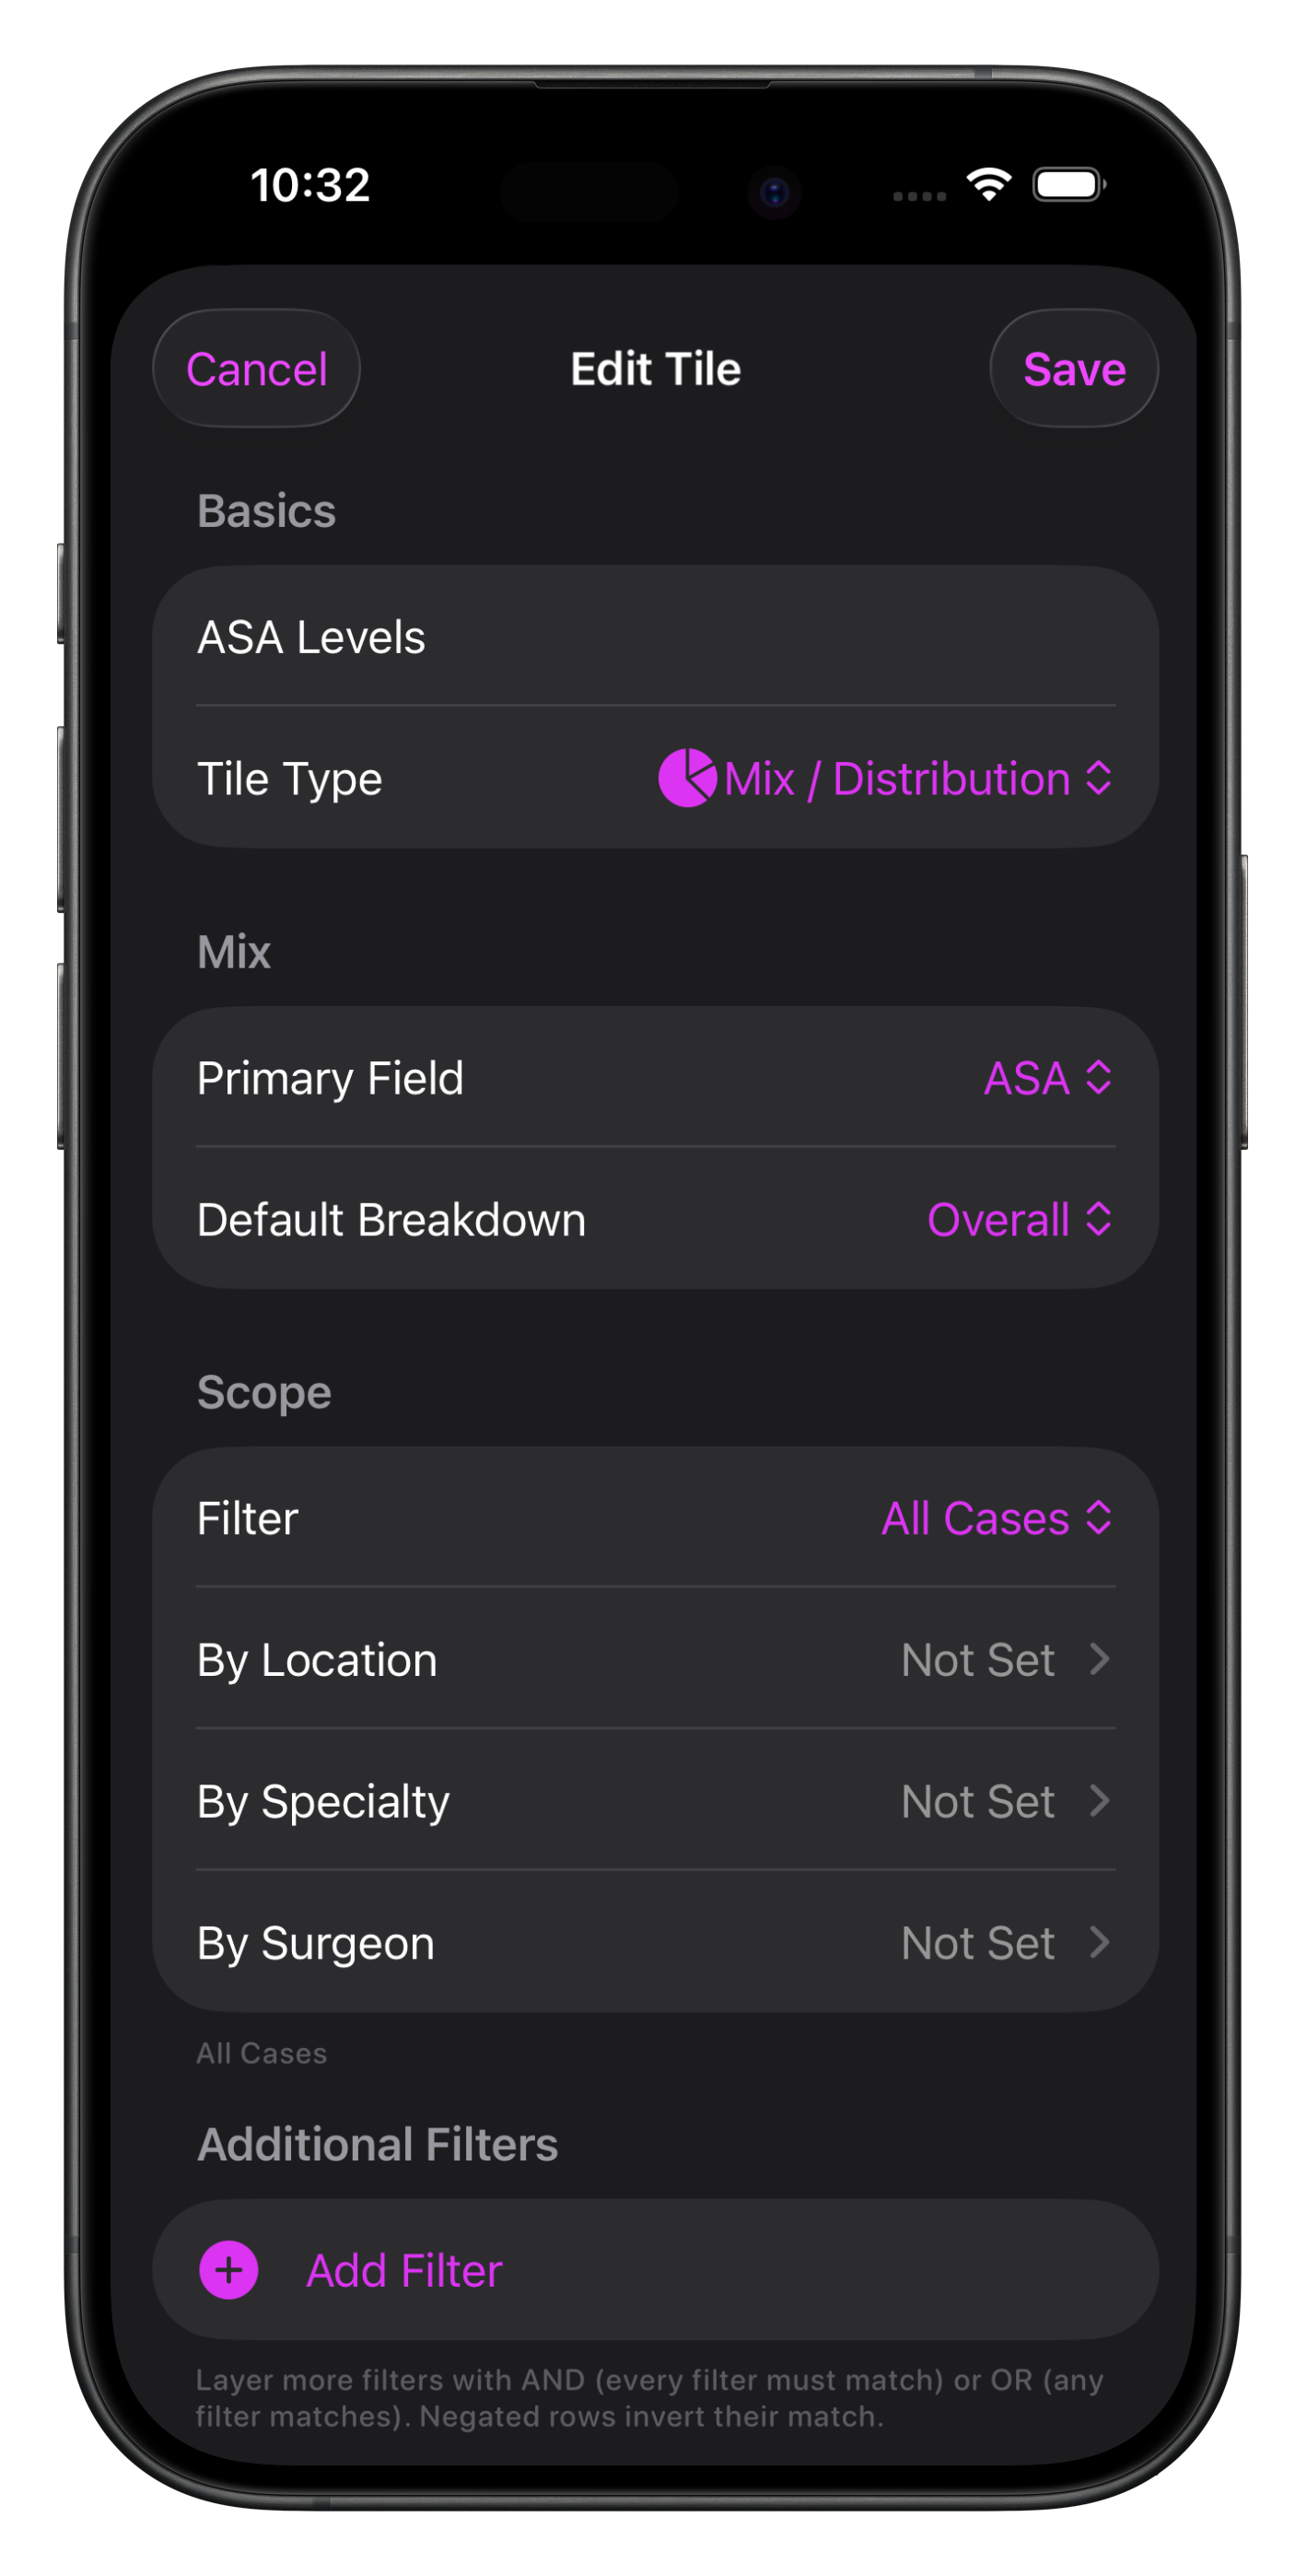
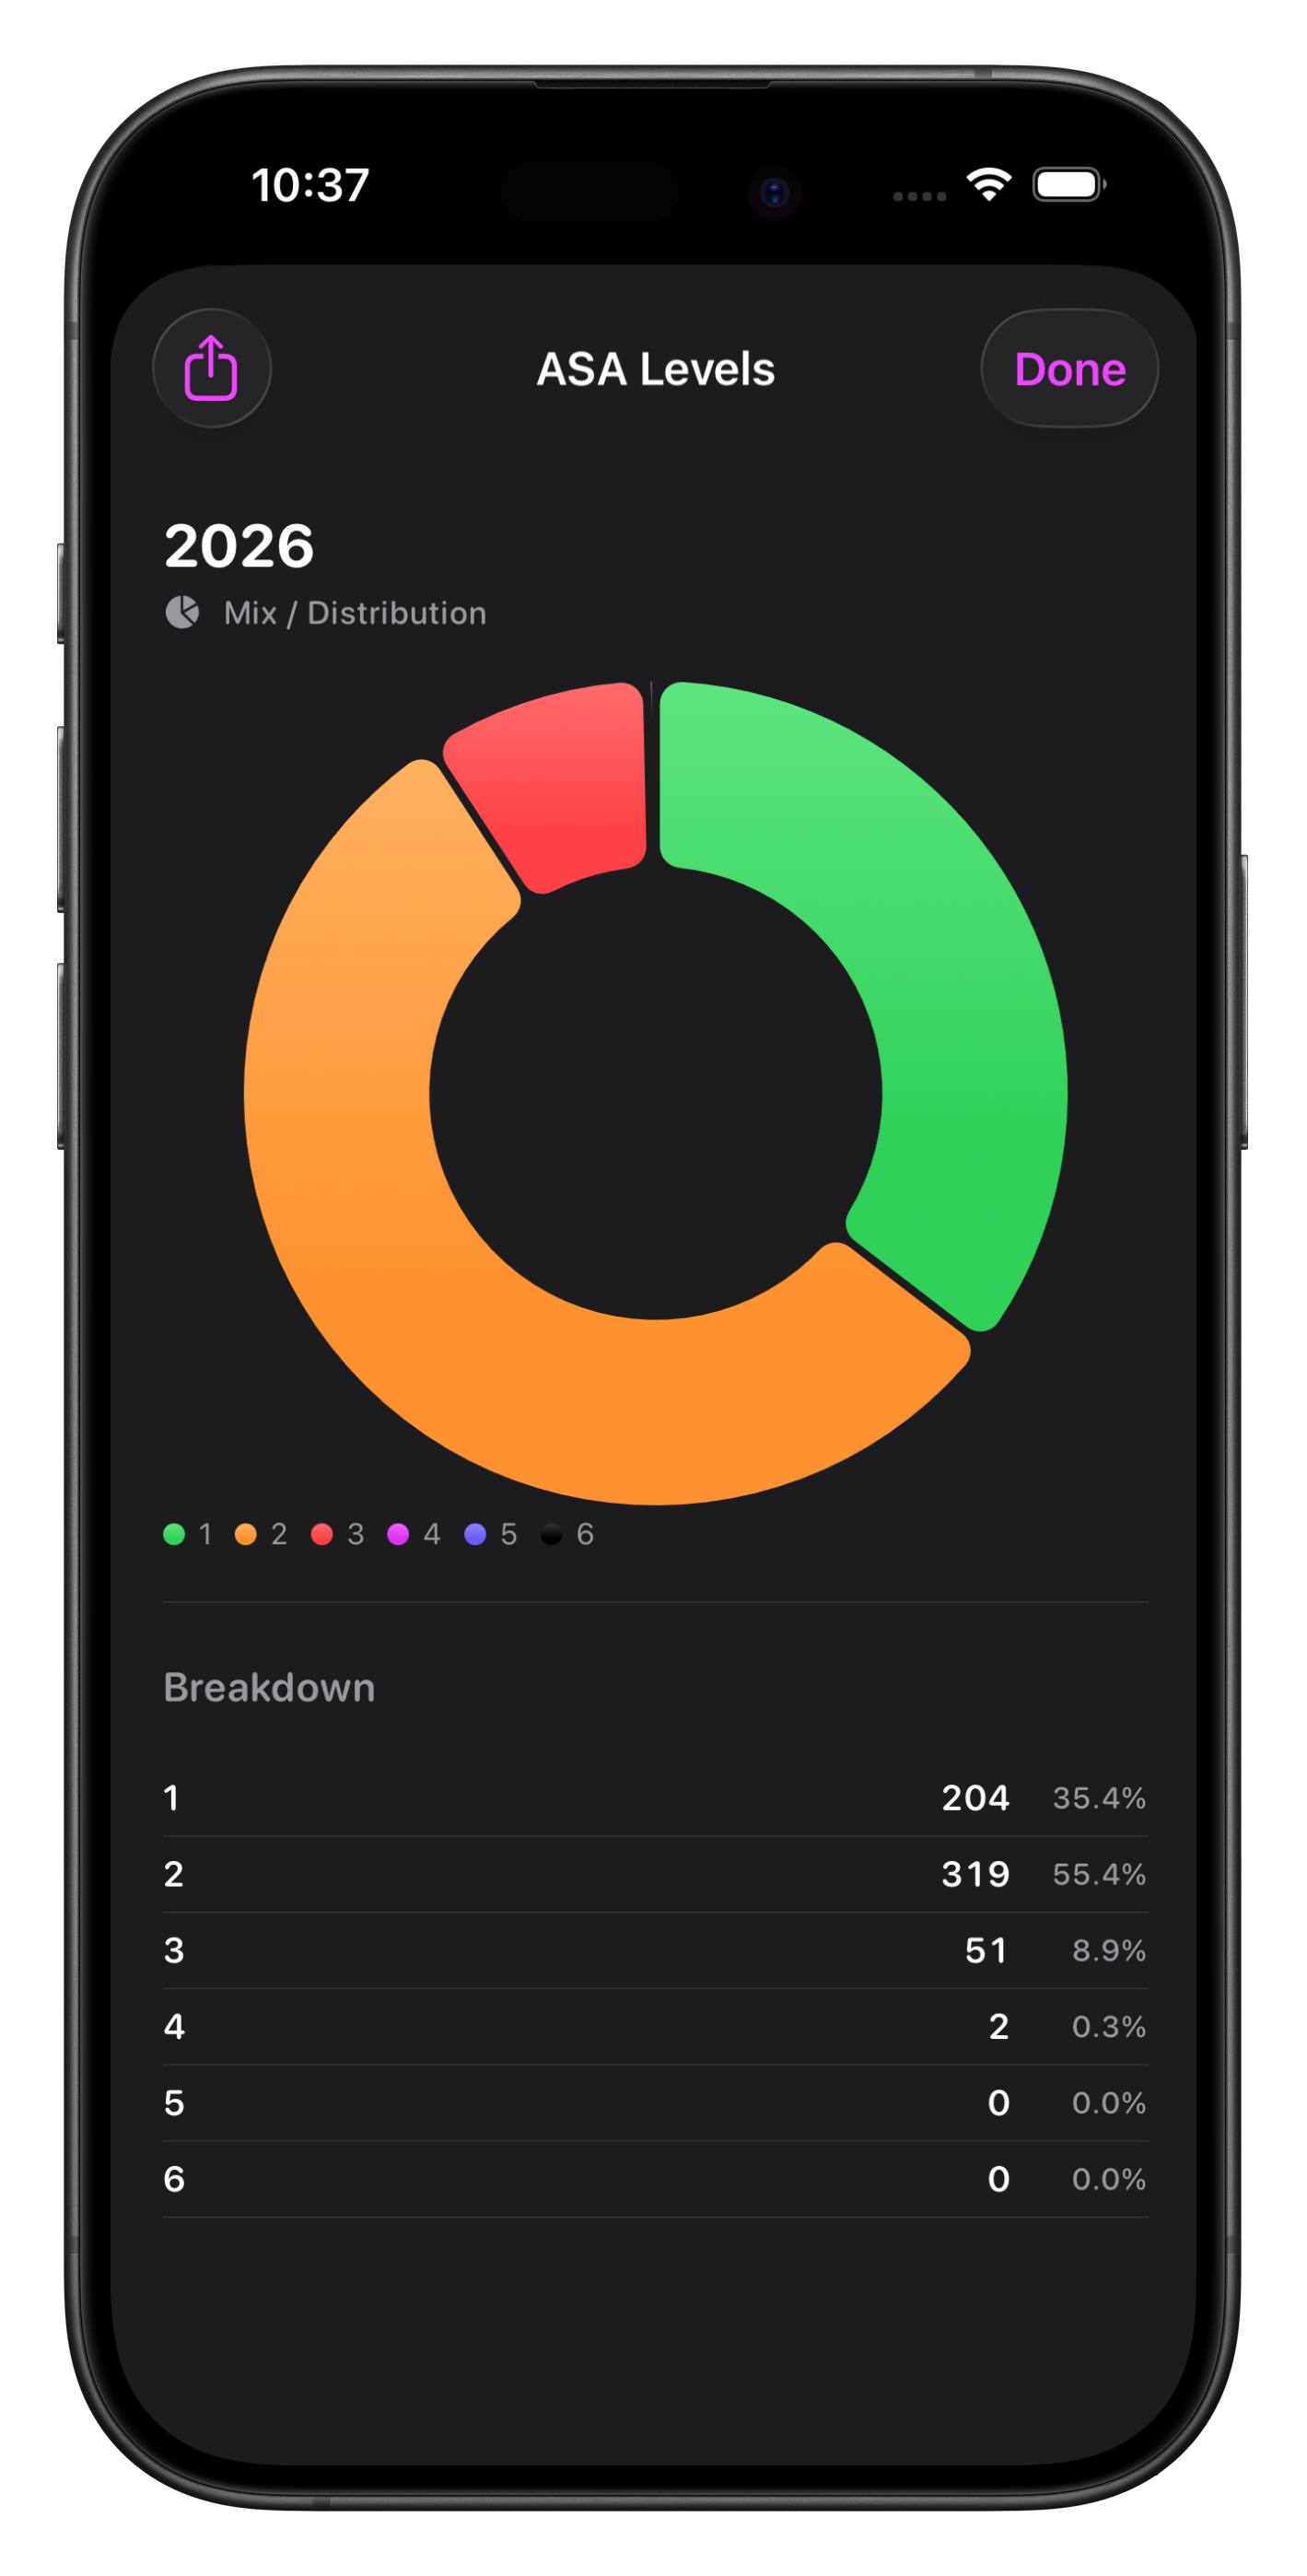
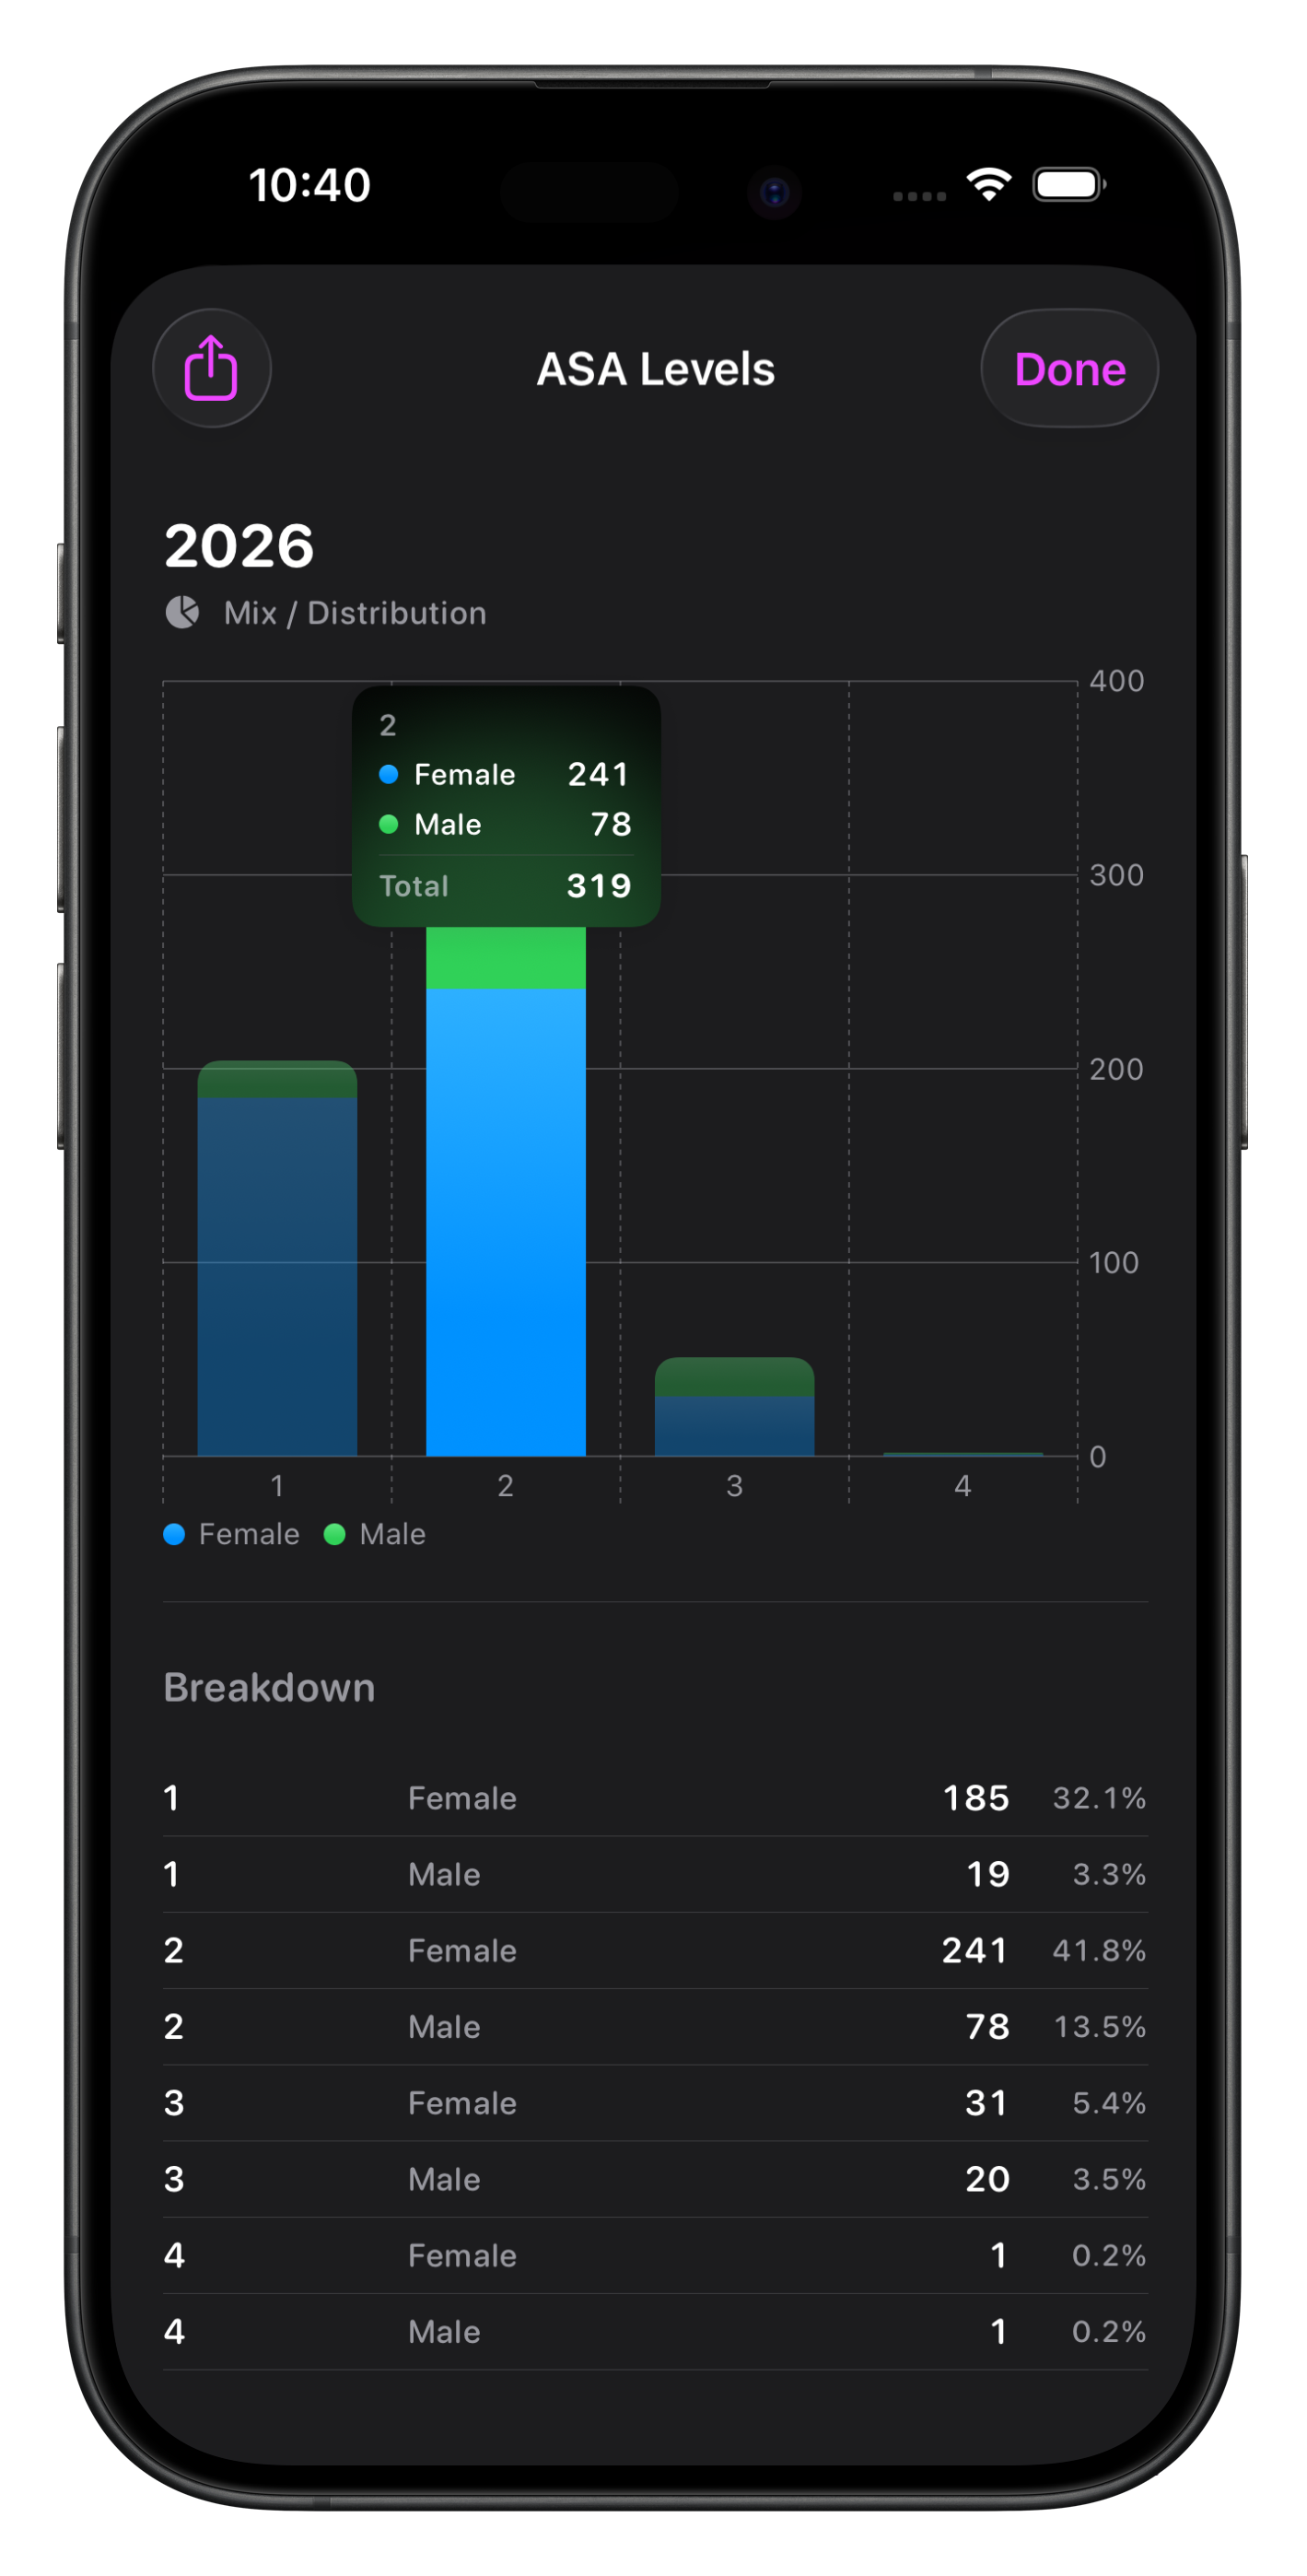
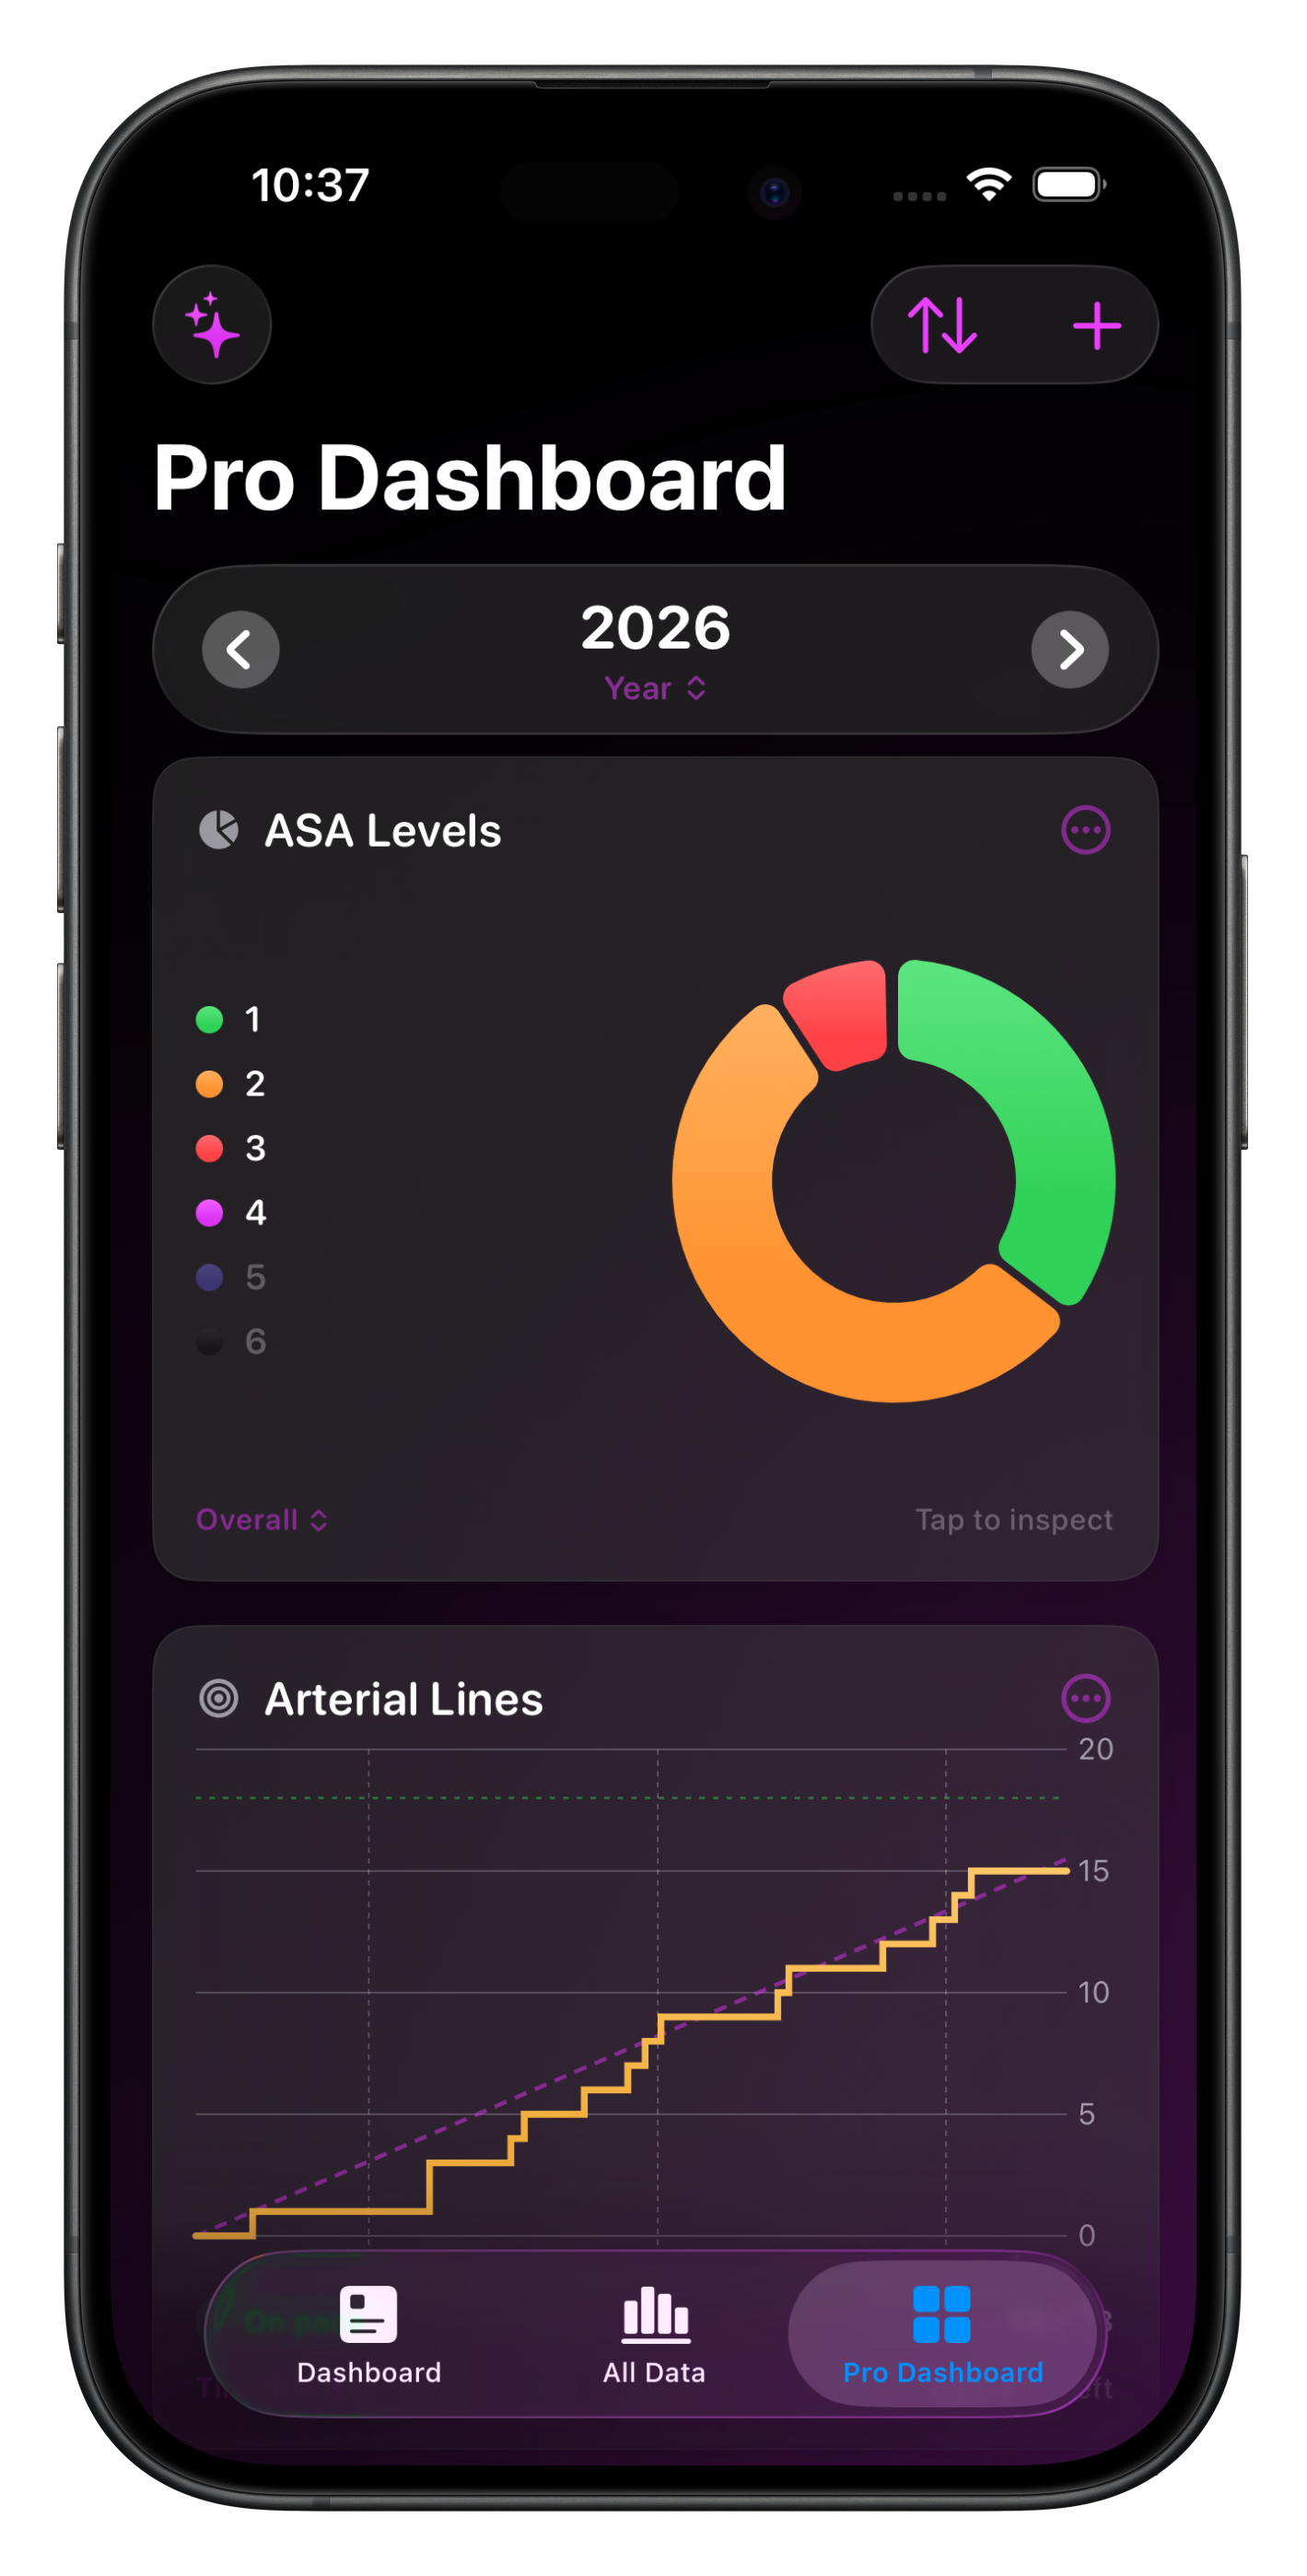
Mix/Distribution
This is useful for categories of items in Somnus that are mutually exclusive, for example:
ASA
Age Range
Gender
Time of Day
Urgency Level
Supervision Level
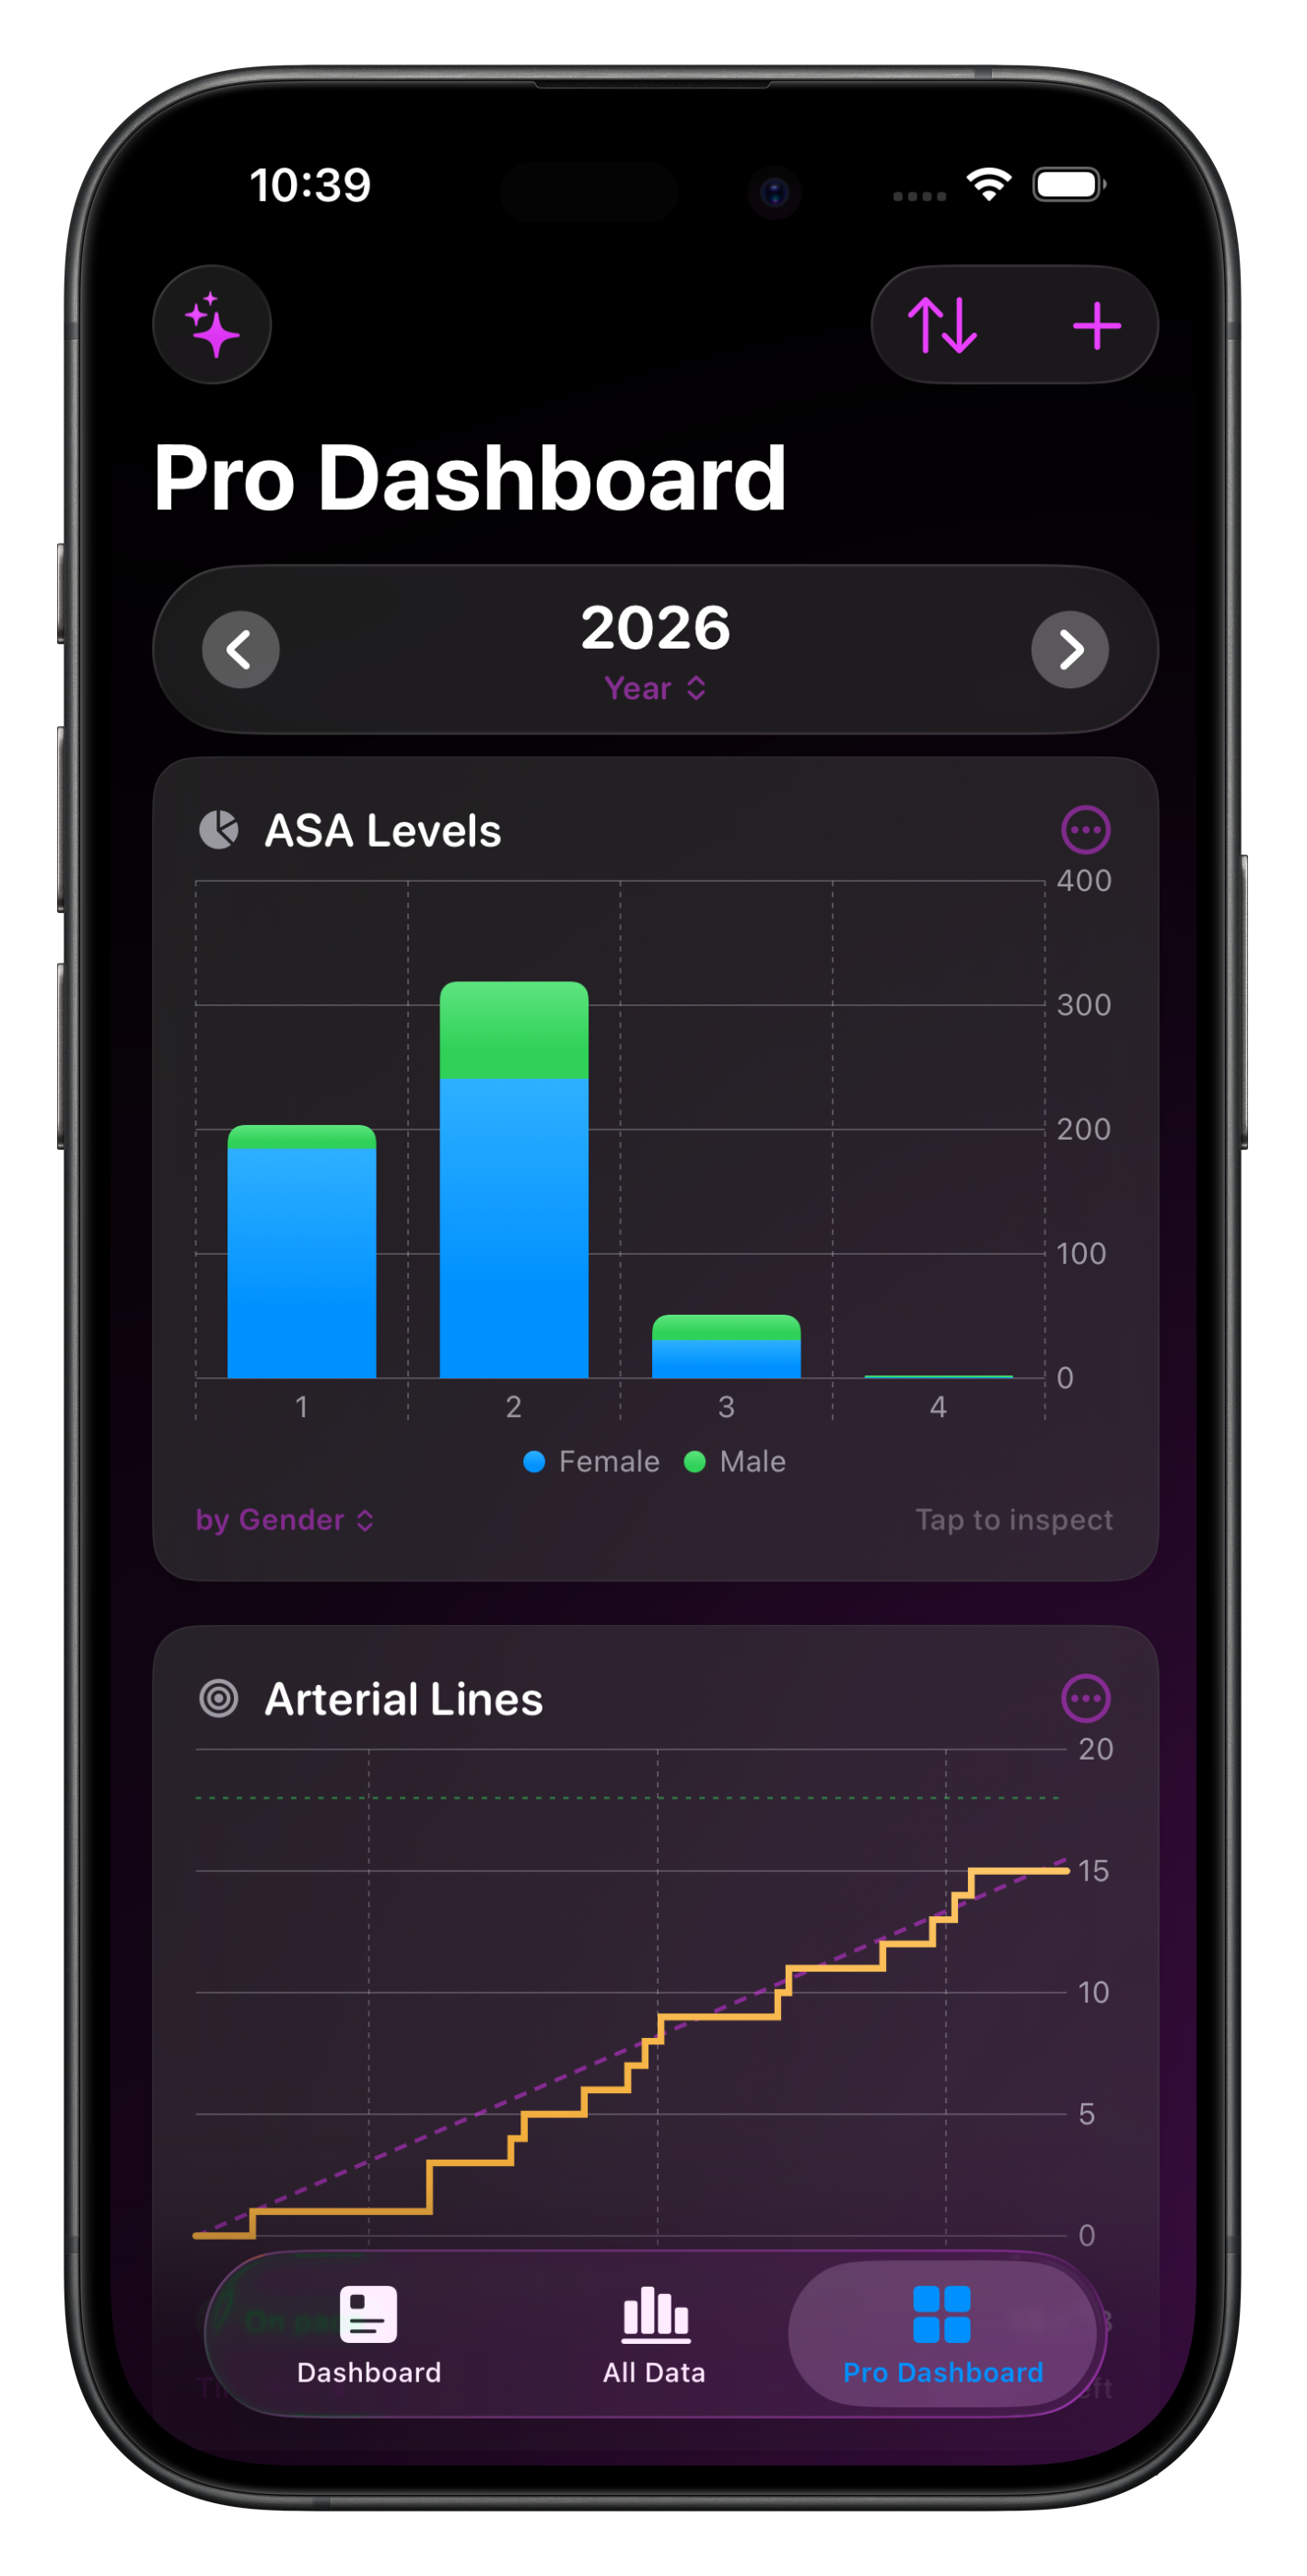
Choose the primary field and then the default breakdown. This allows you to show two fields simultaneously - eg. show ASA mix by gender


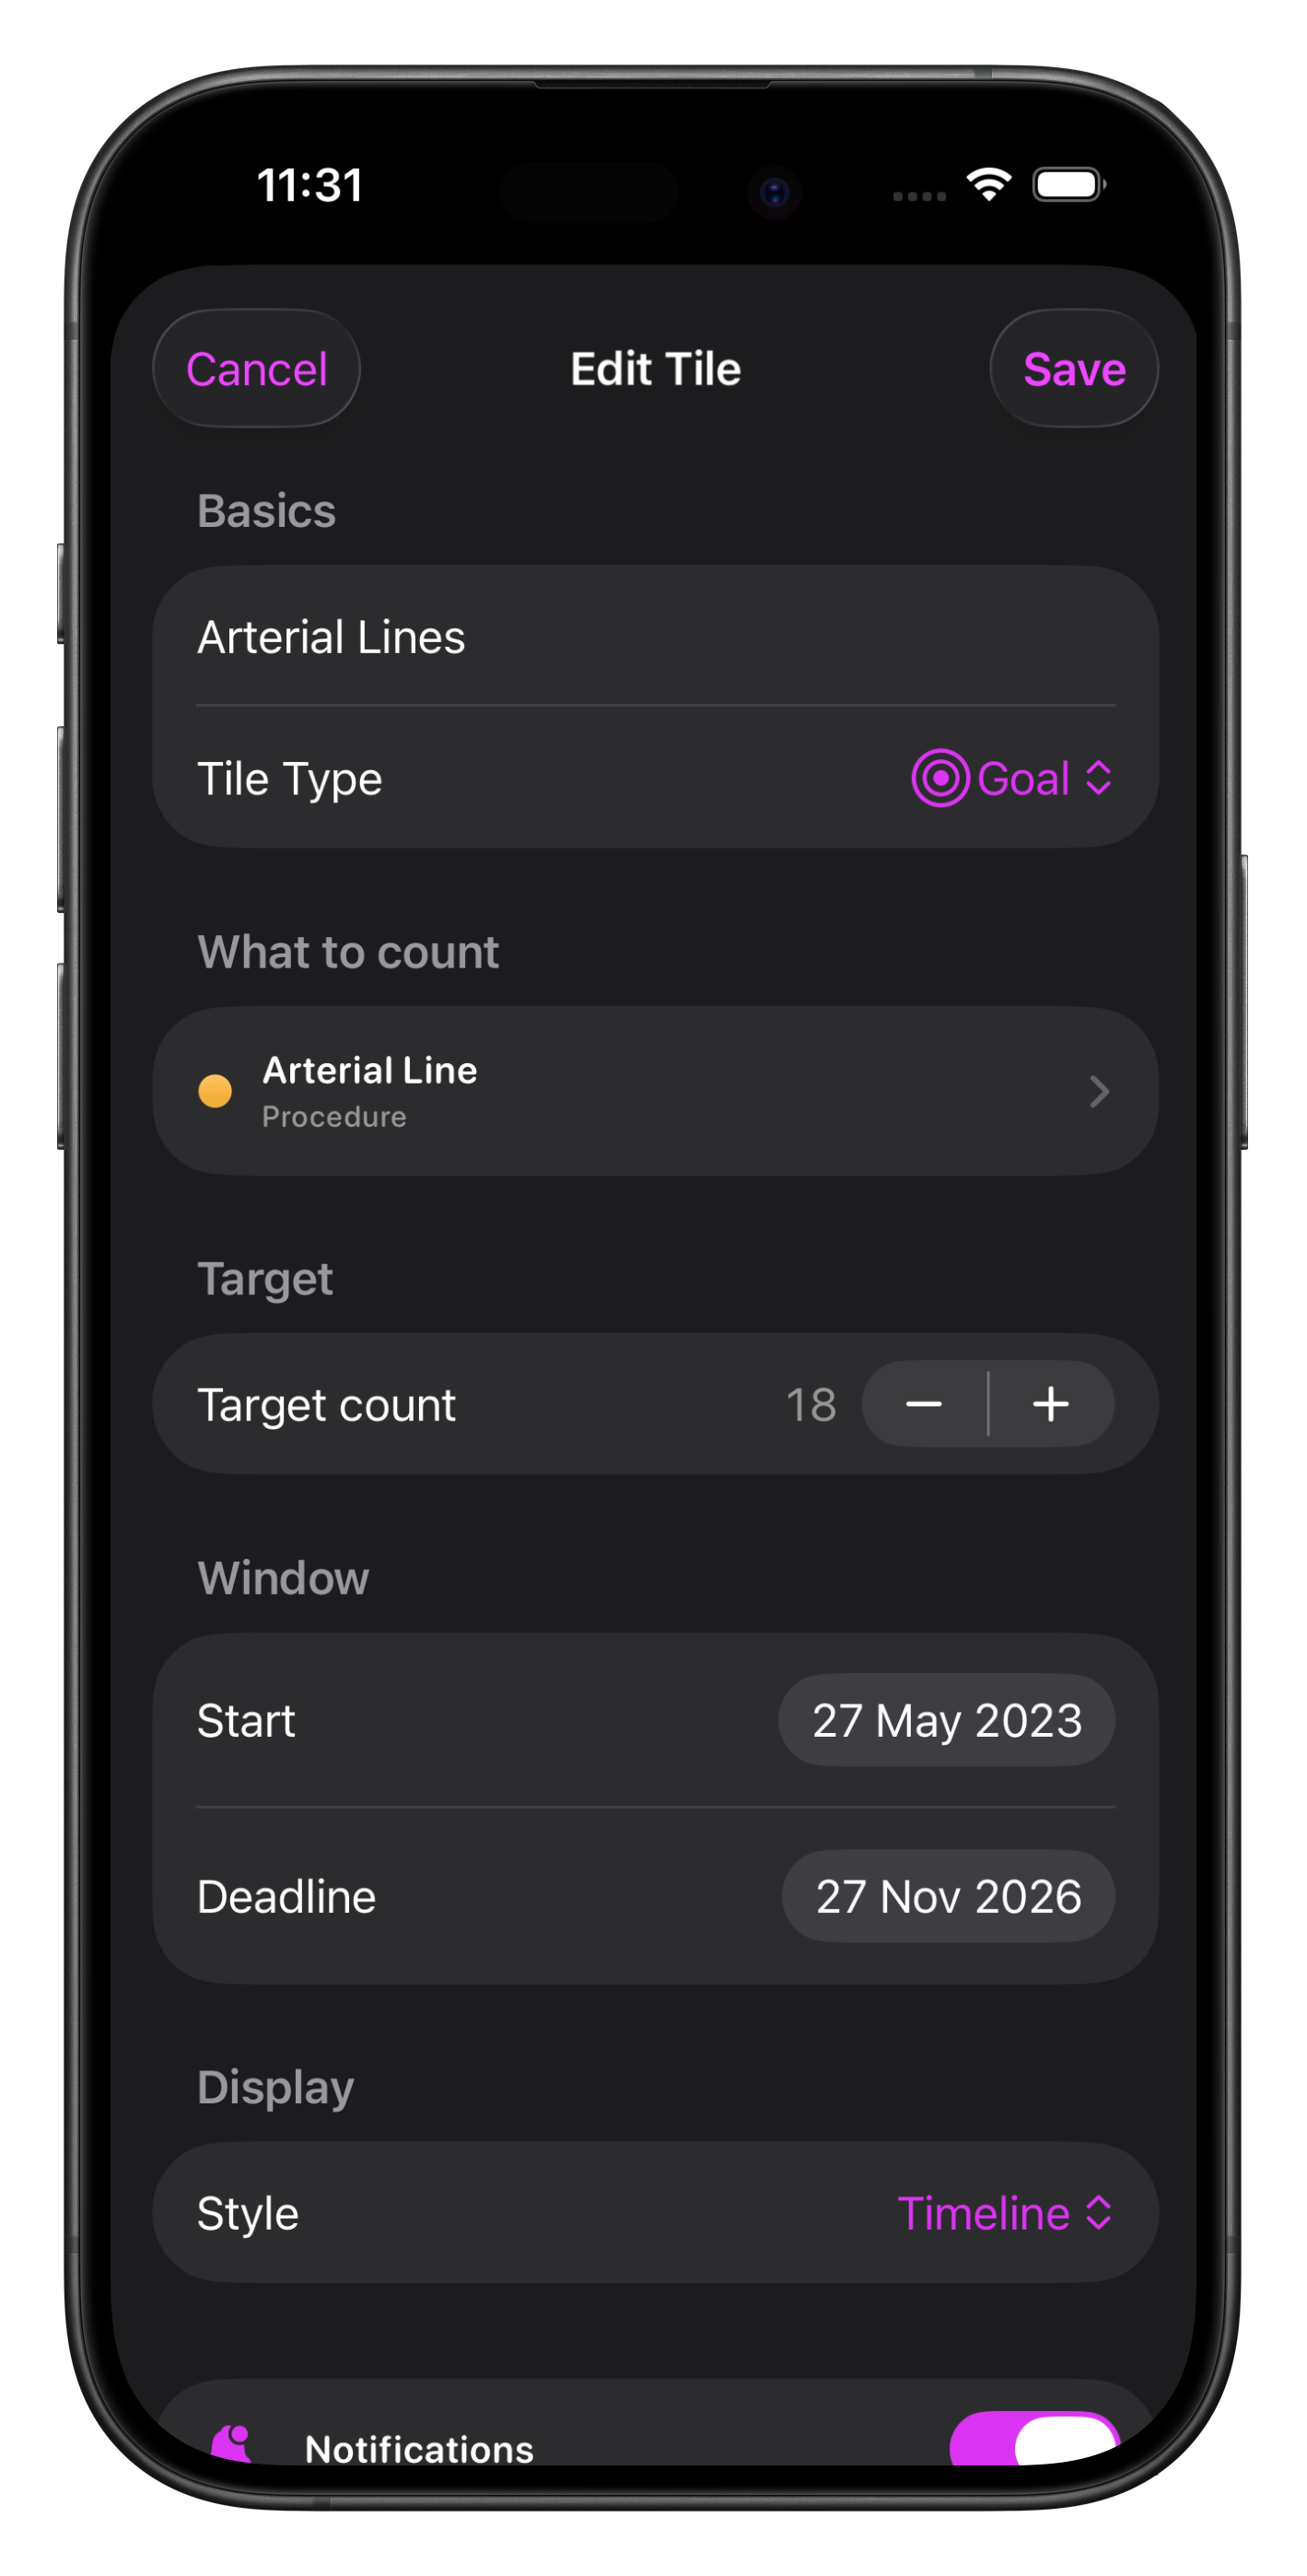
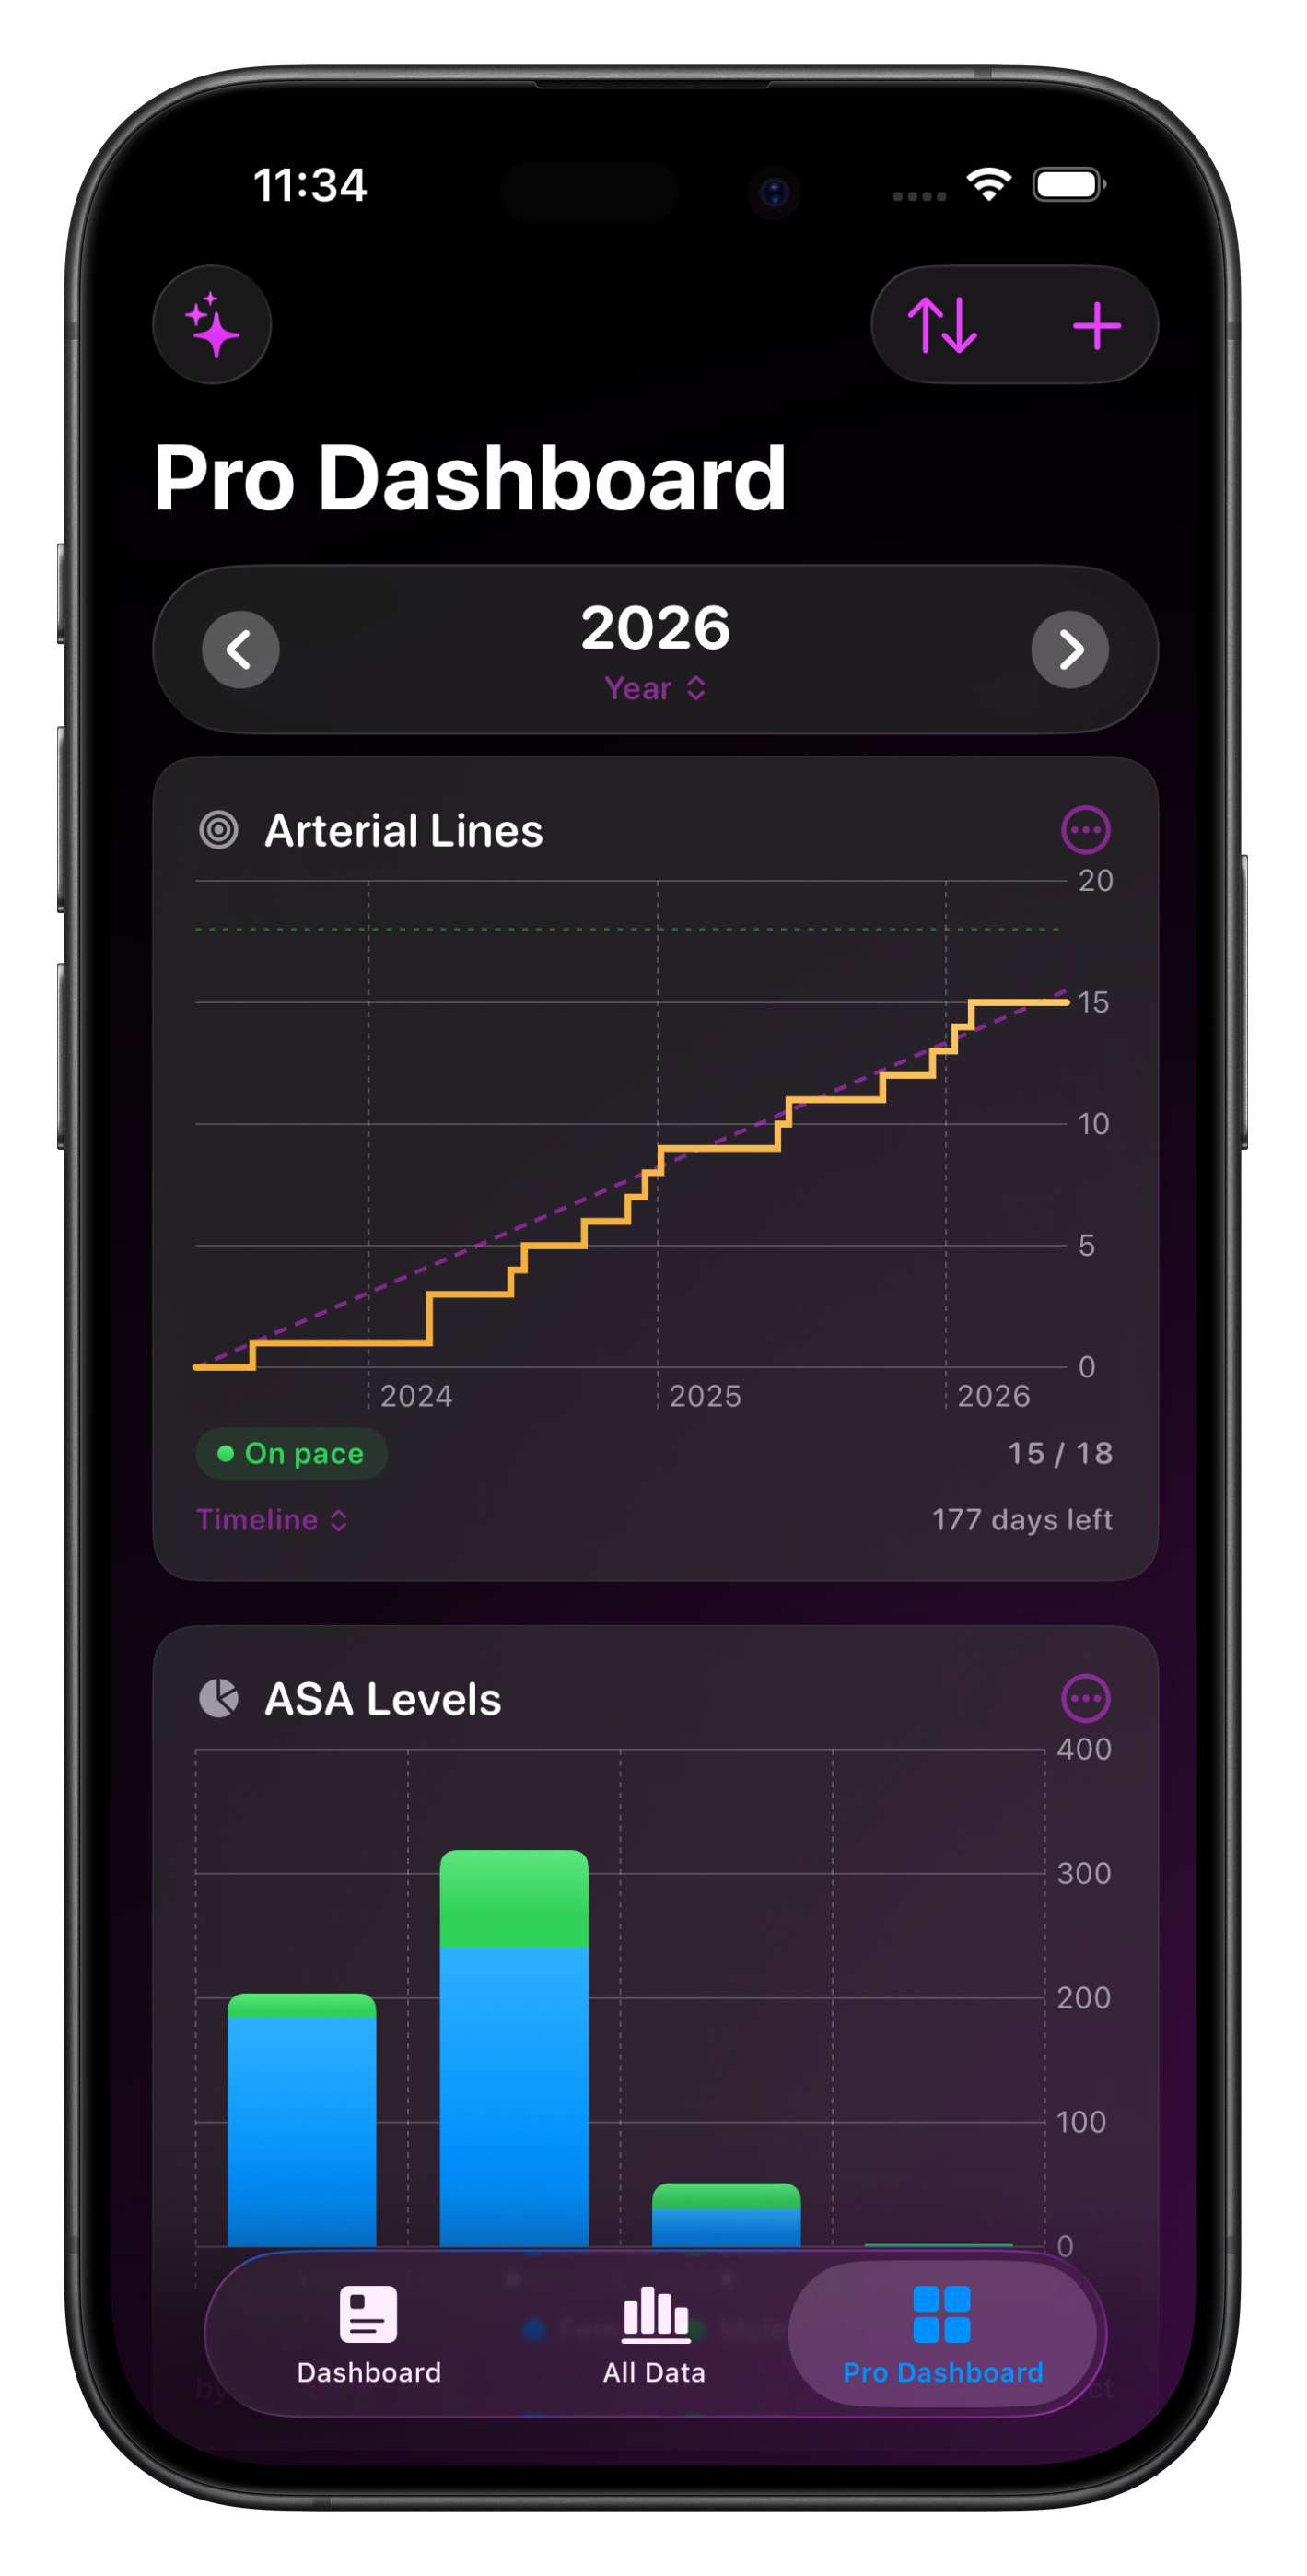
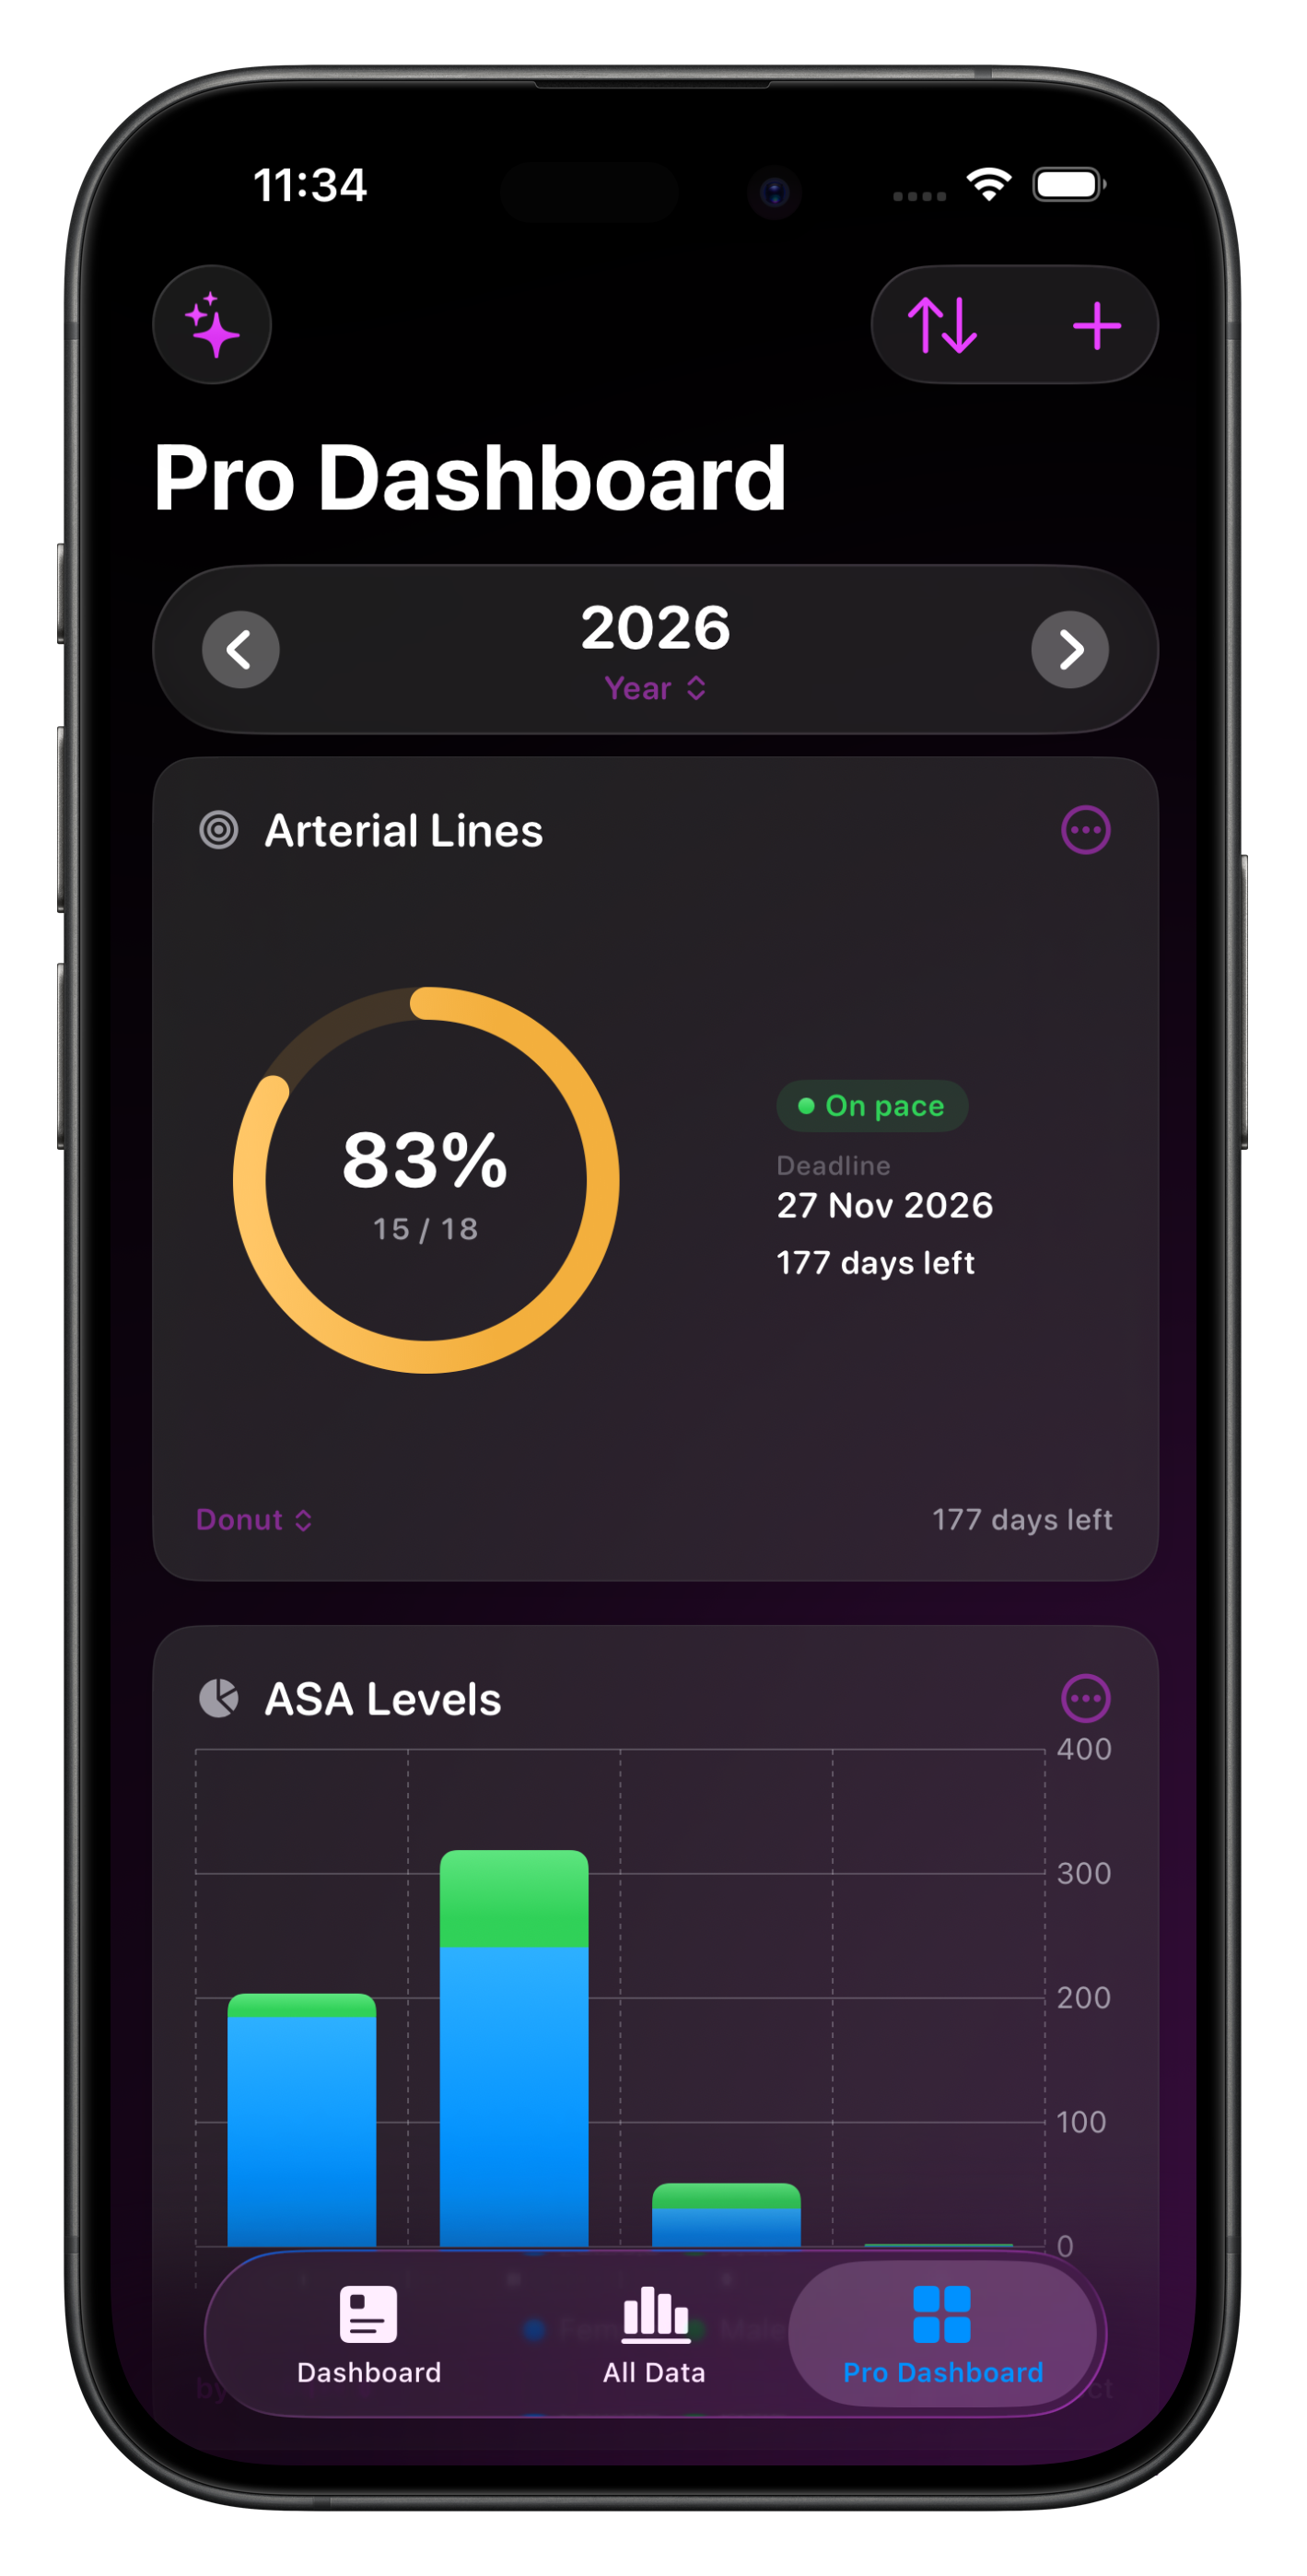
Goal
In the 'What to count’ section, select almost any database item linked to Cases in Somnus, including Supervision Levels, ASA, Procedures and more…
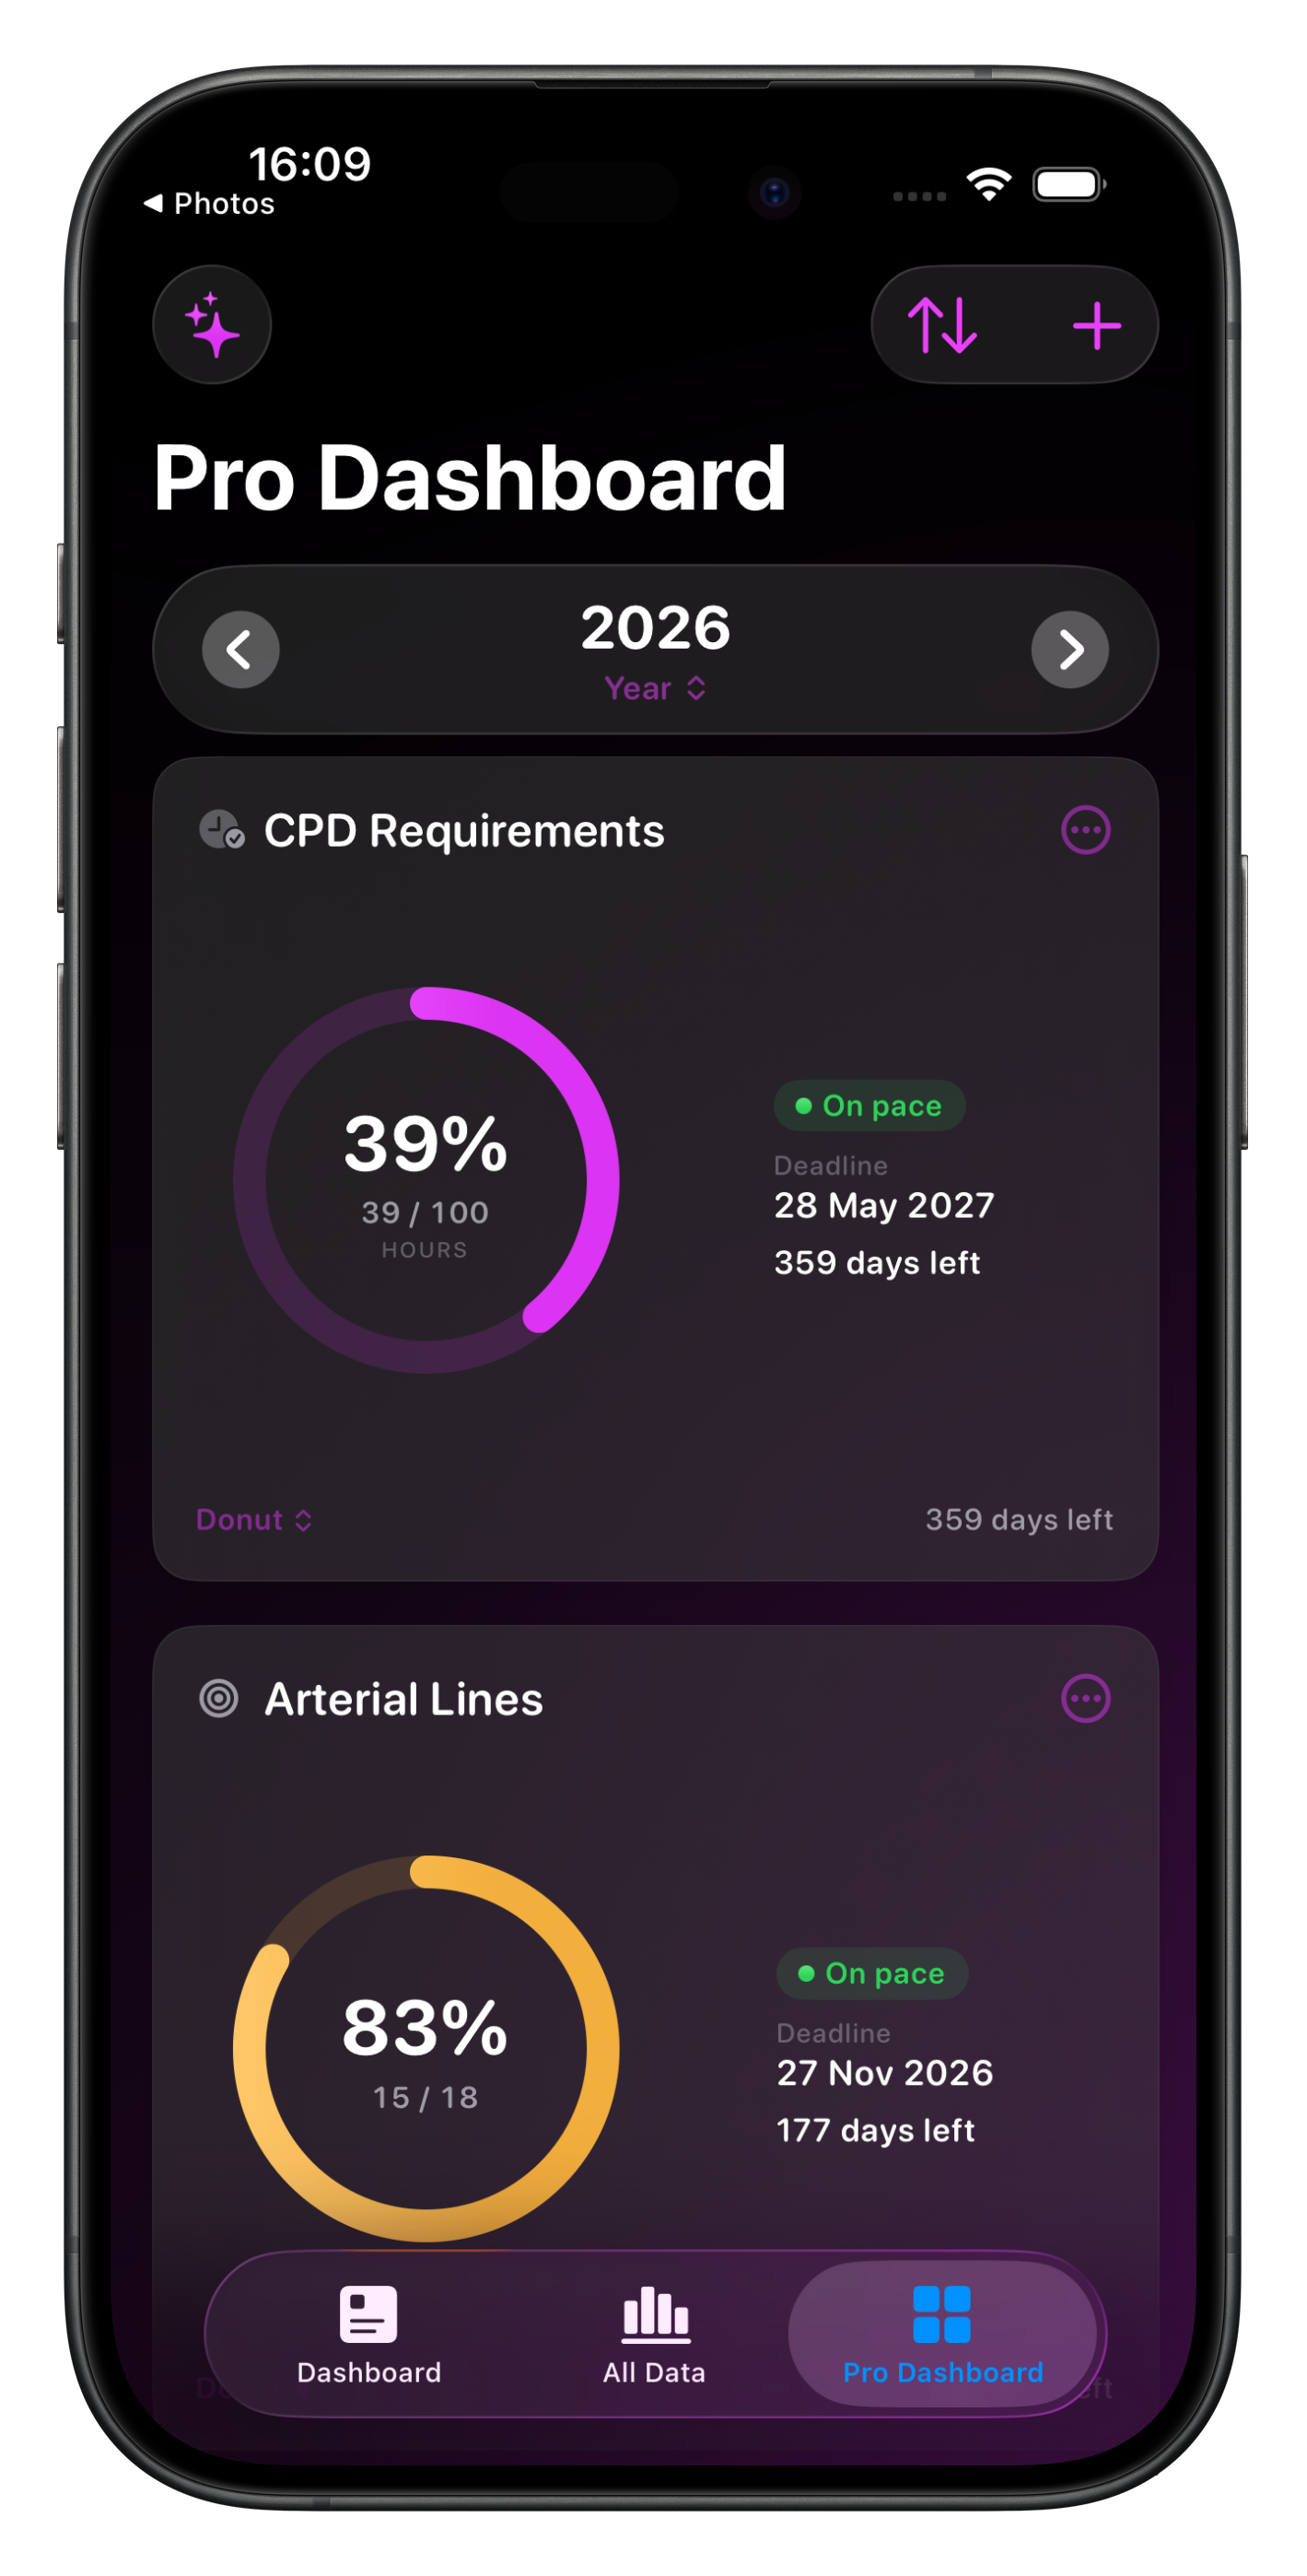
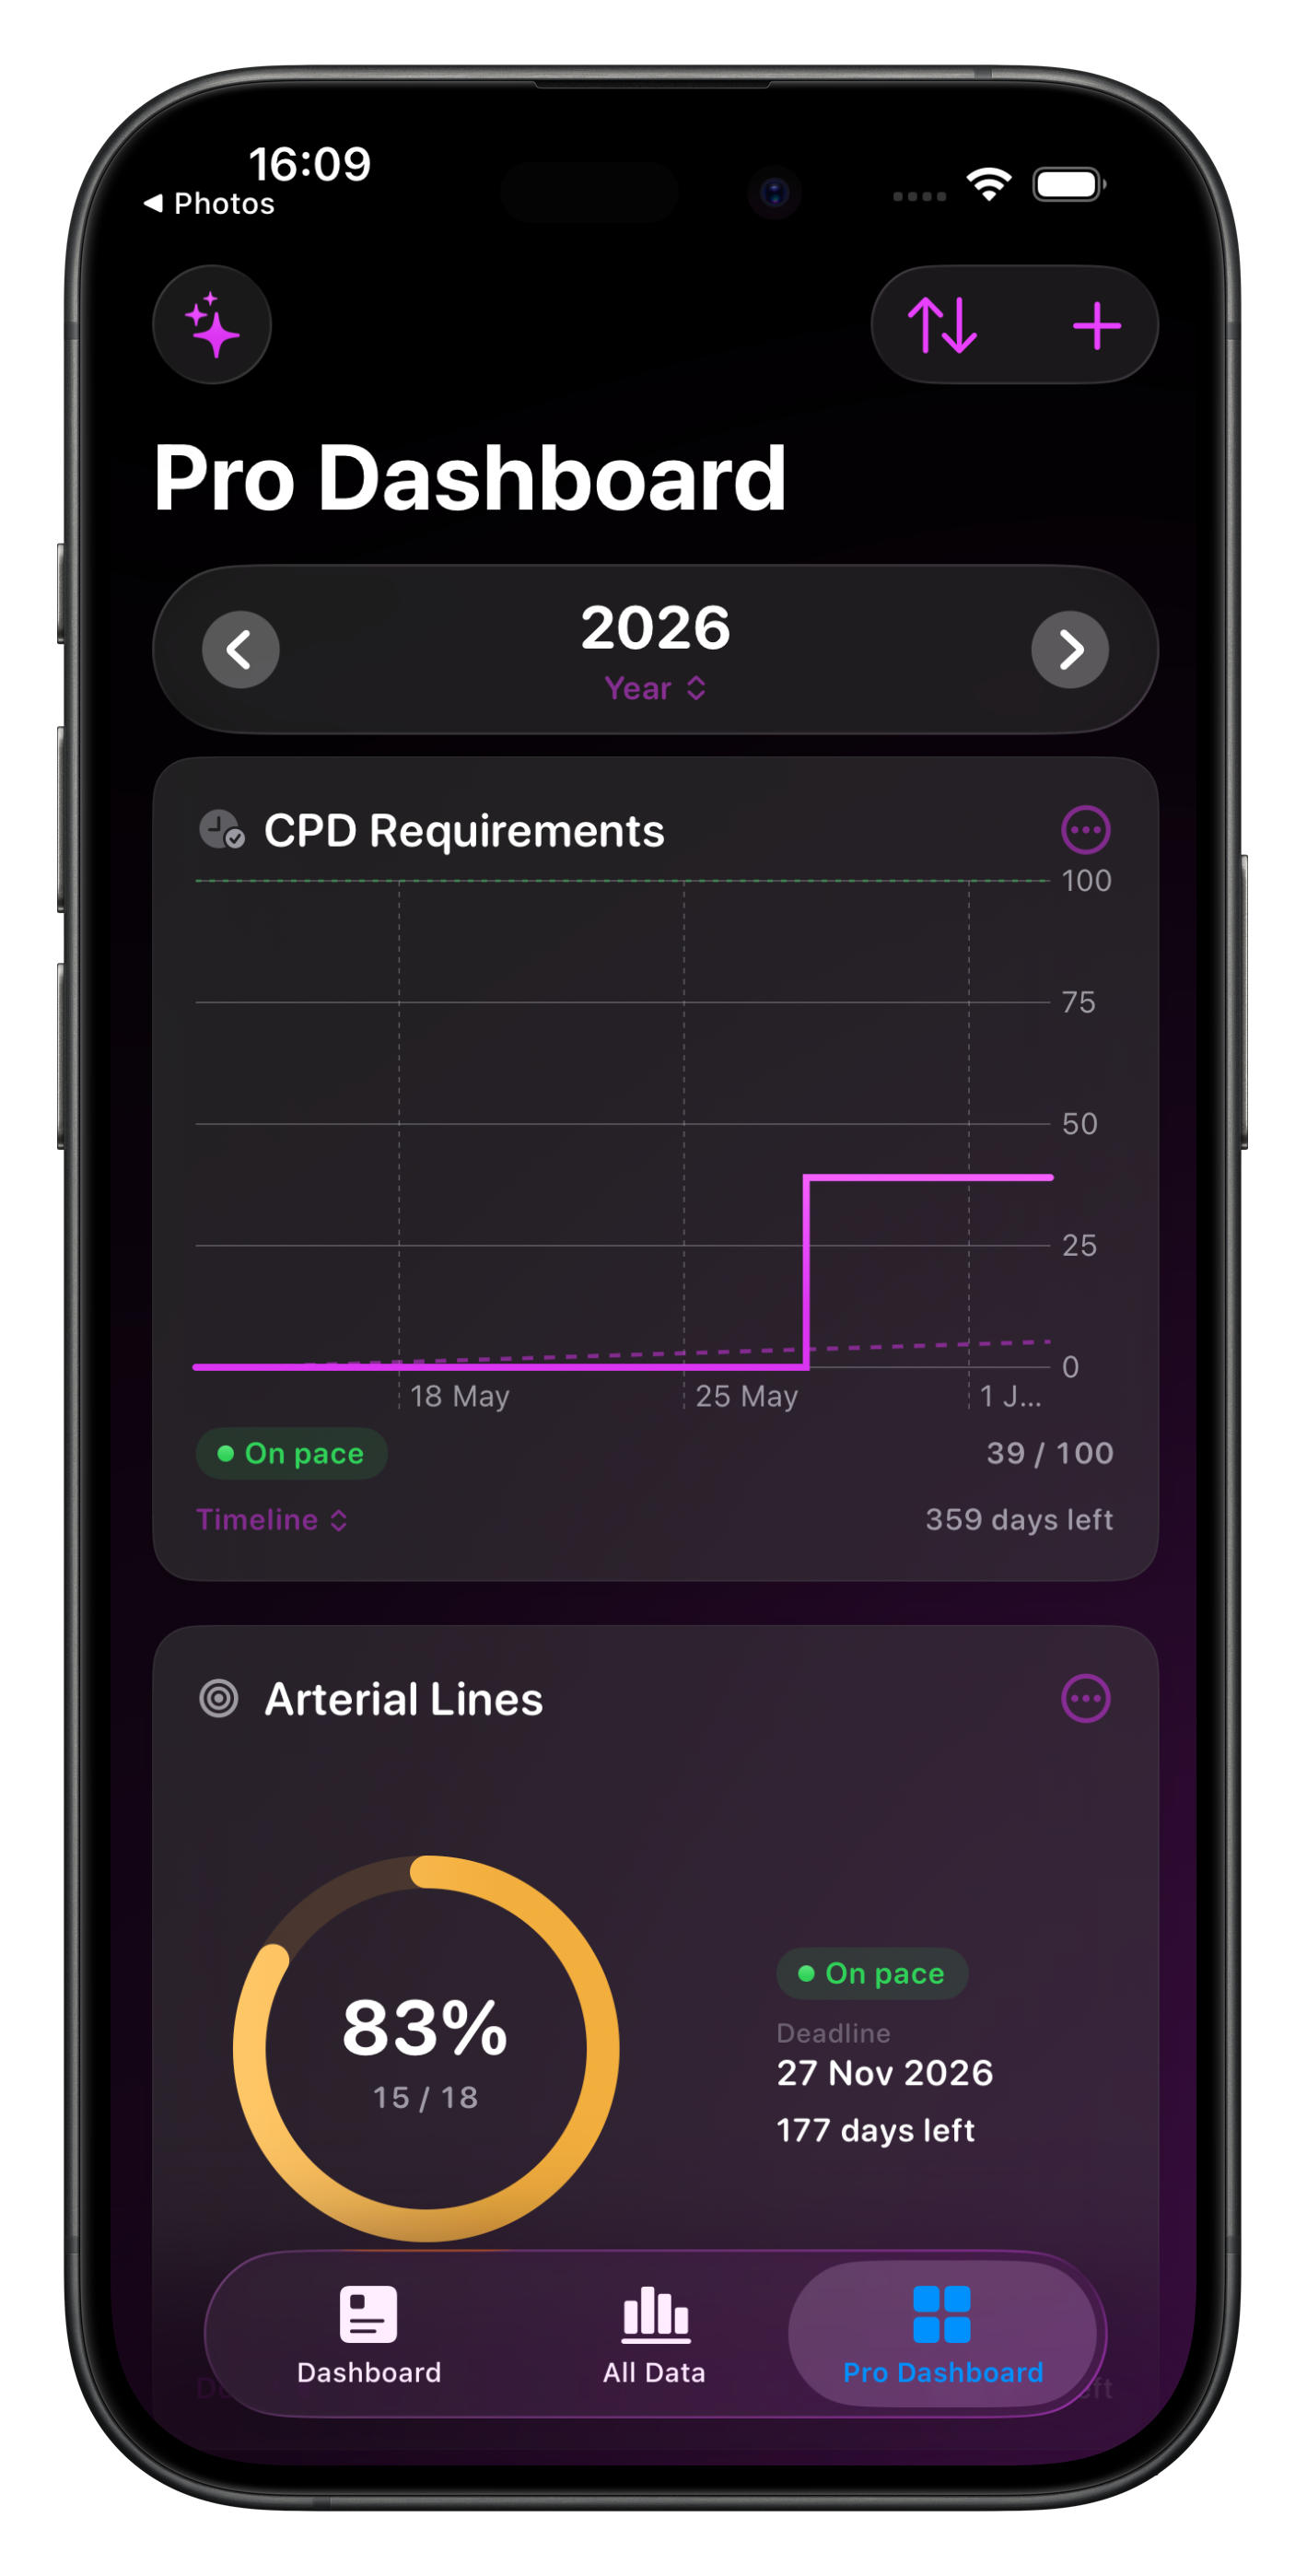
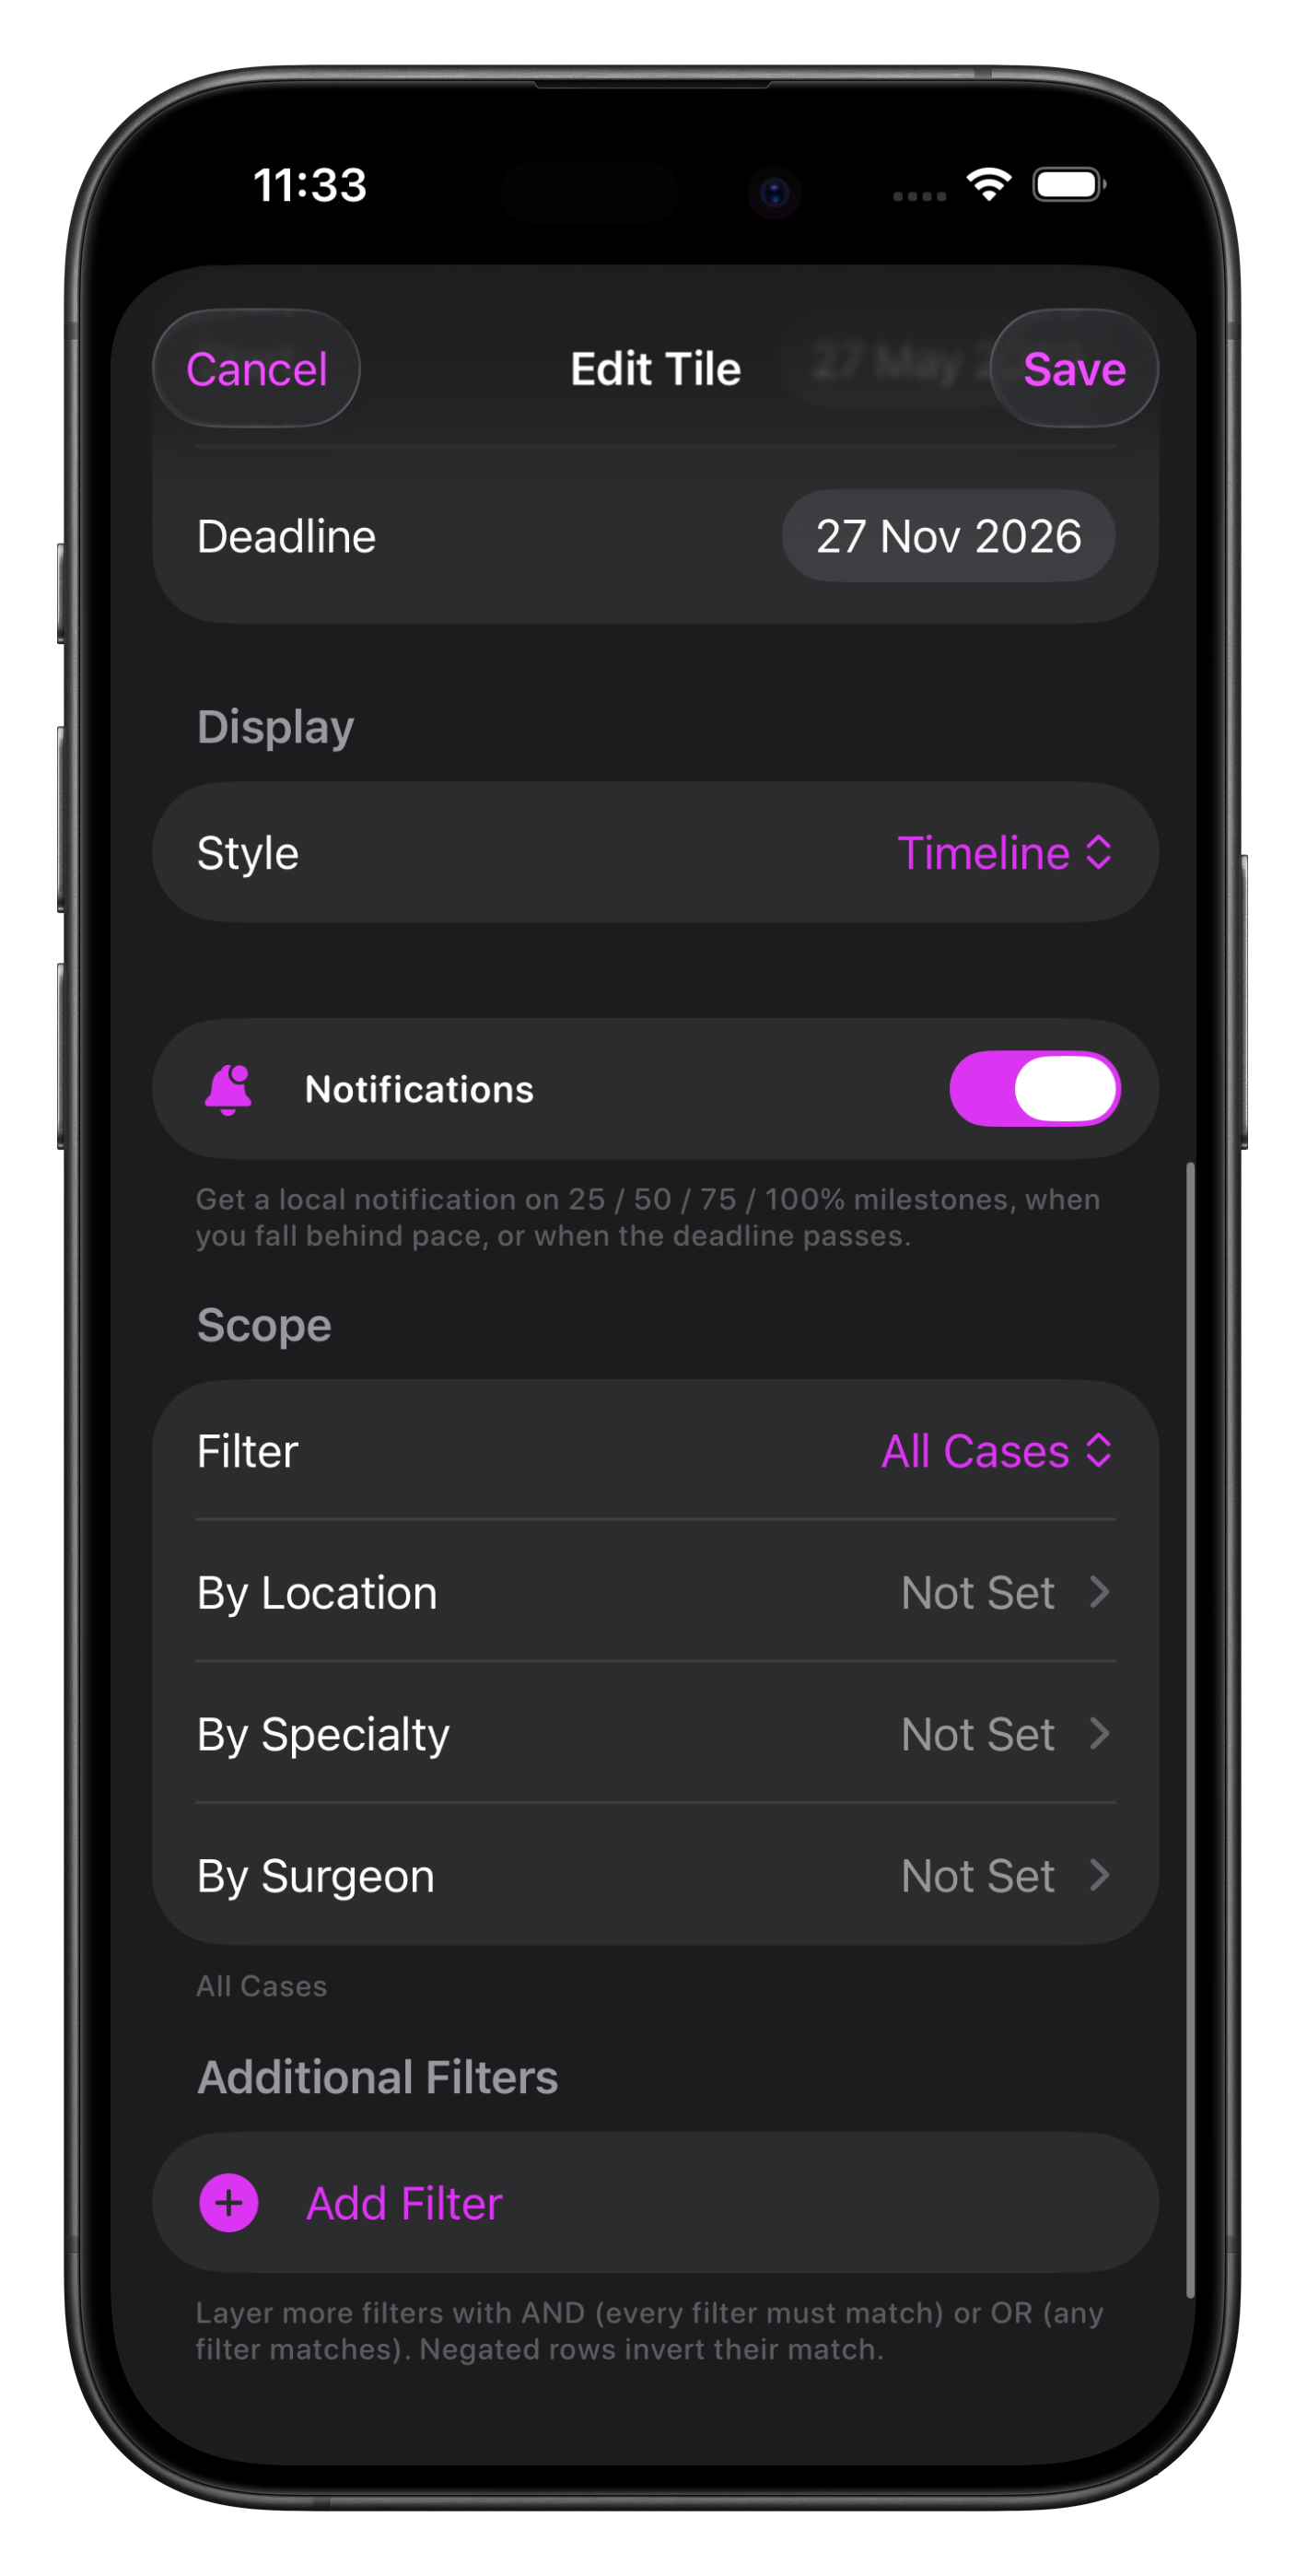
Set your target count and the date range which you want to track. The chart tile can be displayed as either a timeline or donut, also adjustable from the Pro Dashboard directly.
If you would like to receive progress notifications this can be set here as well as the same sort of scope filters as other chart tiles.


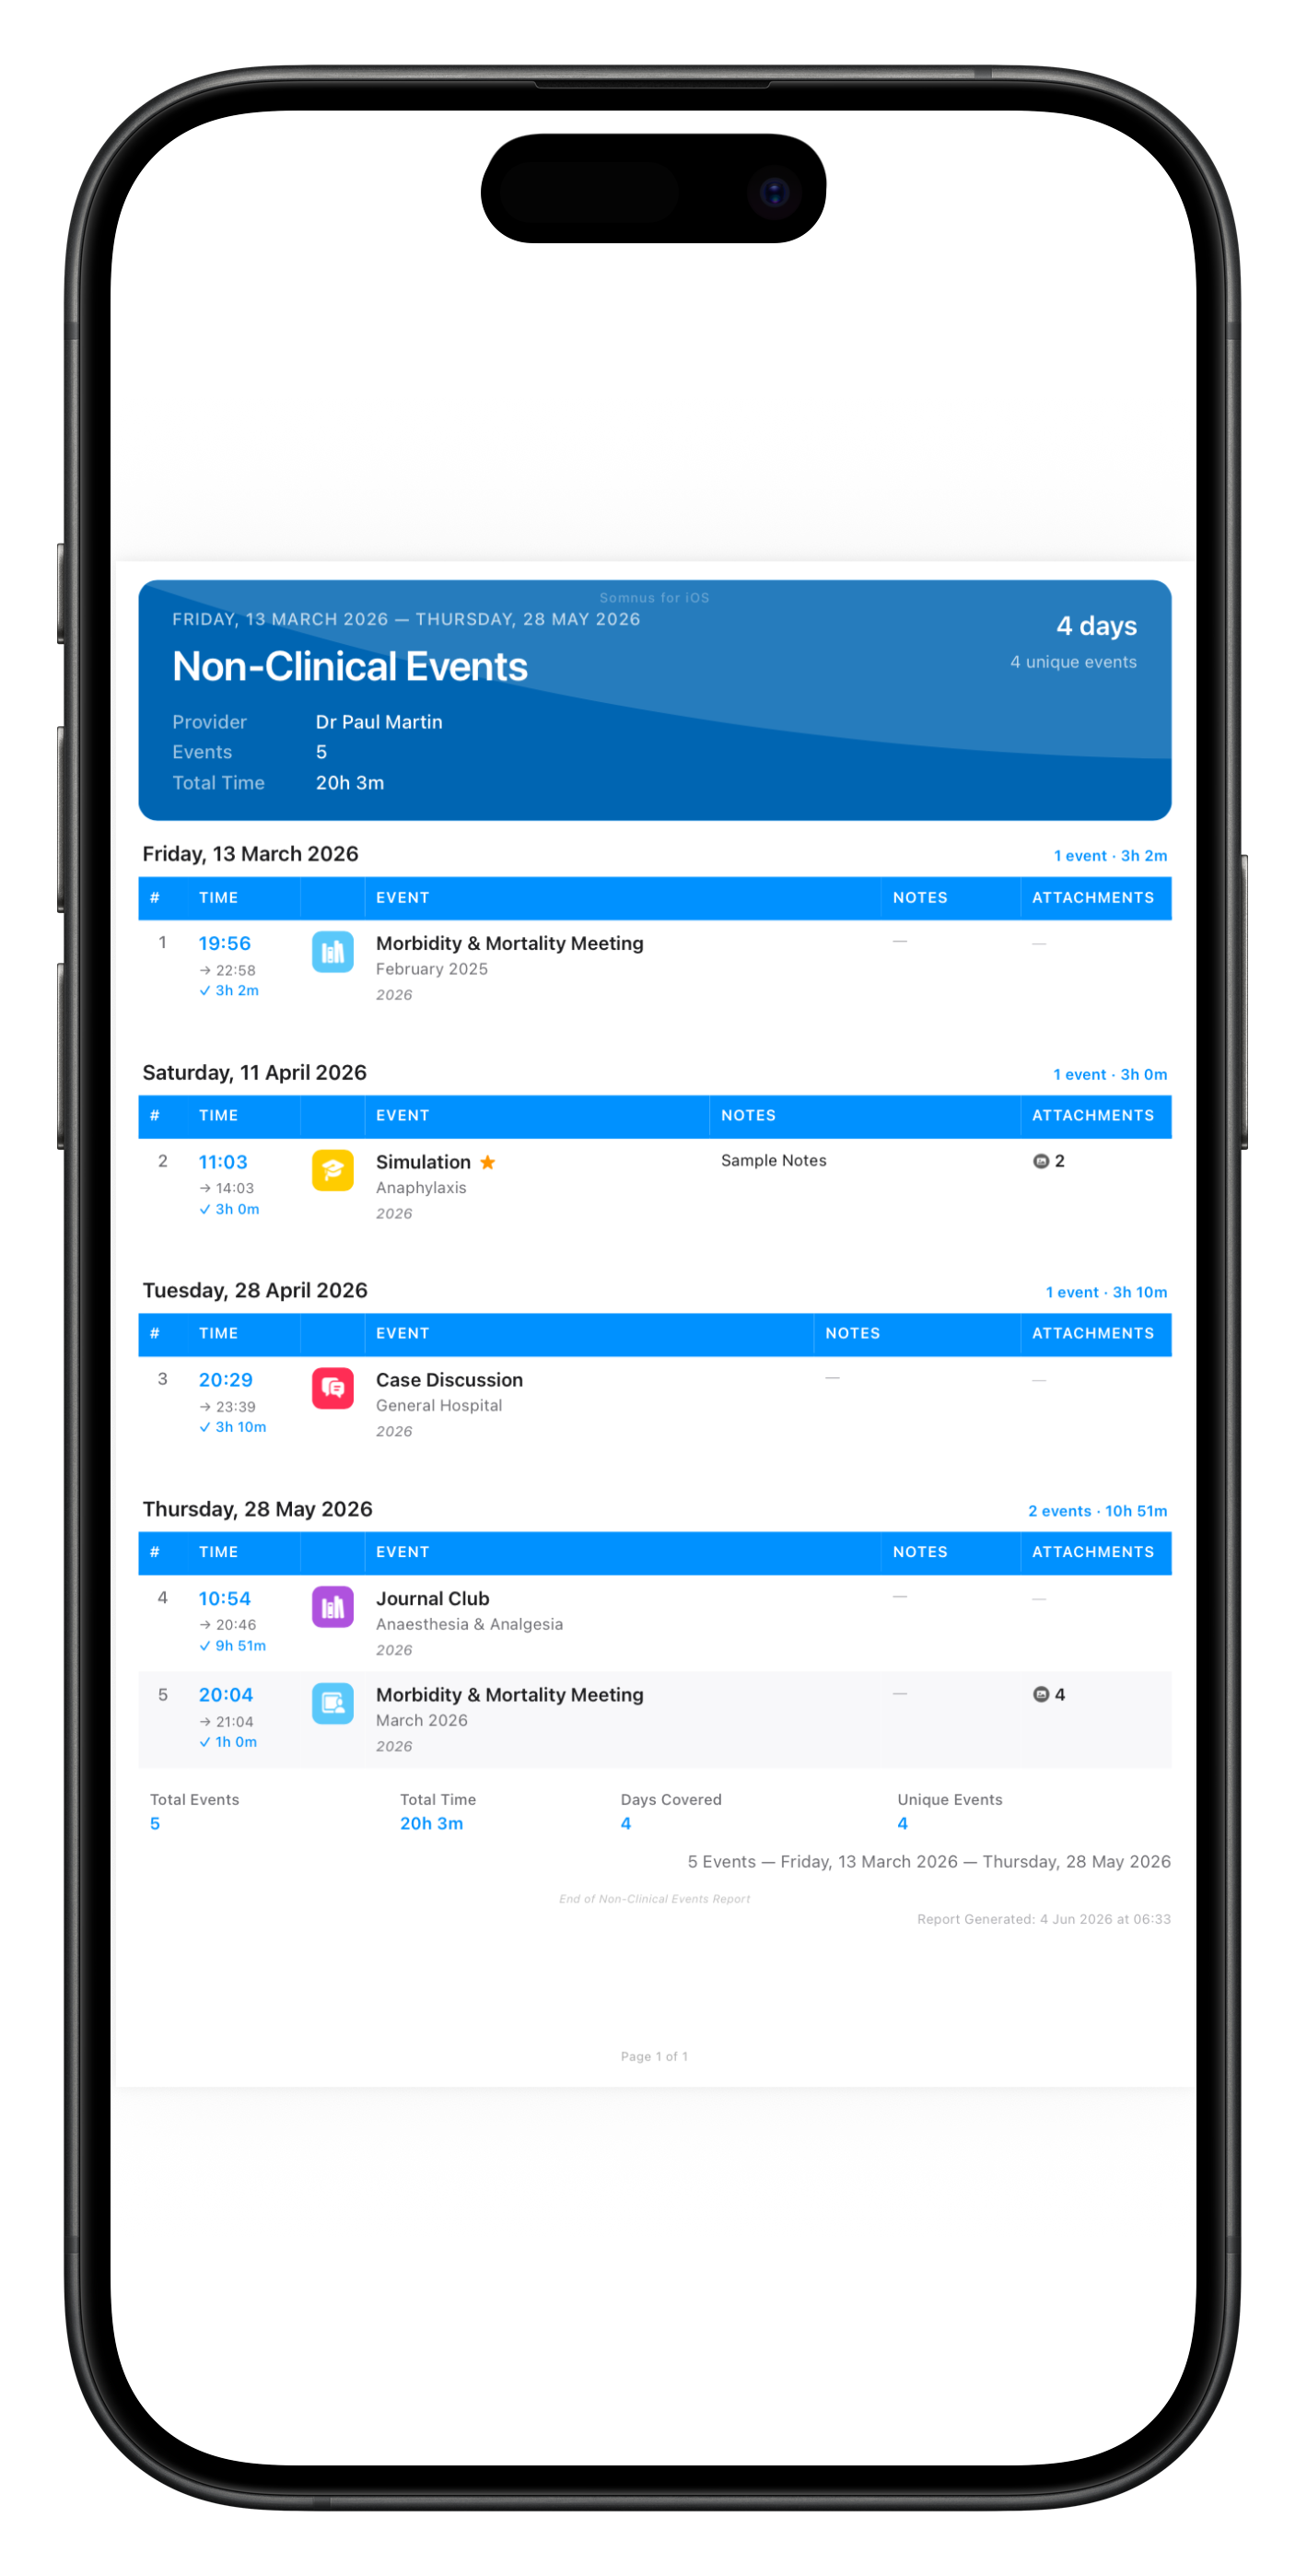
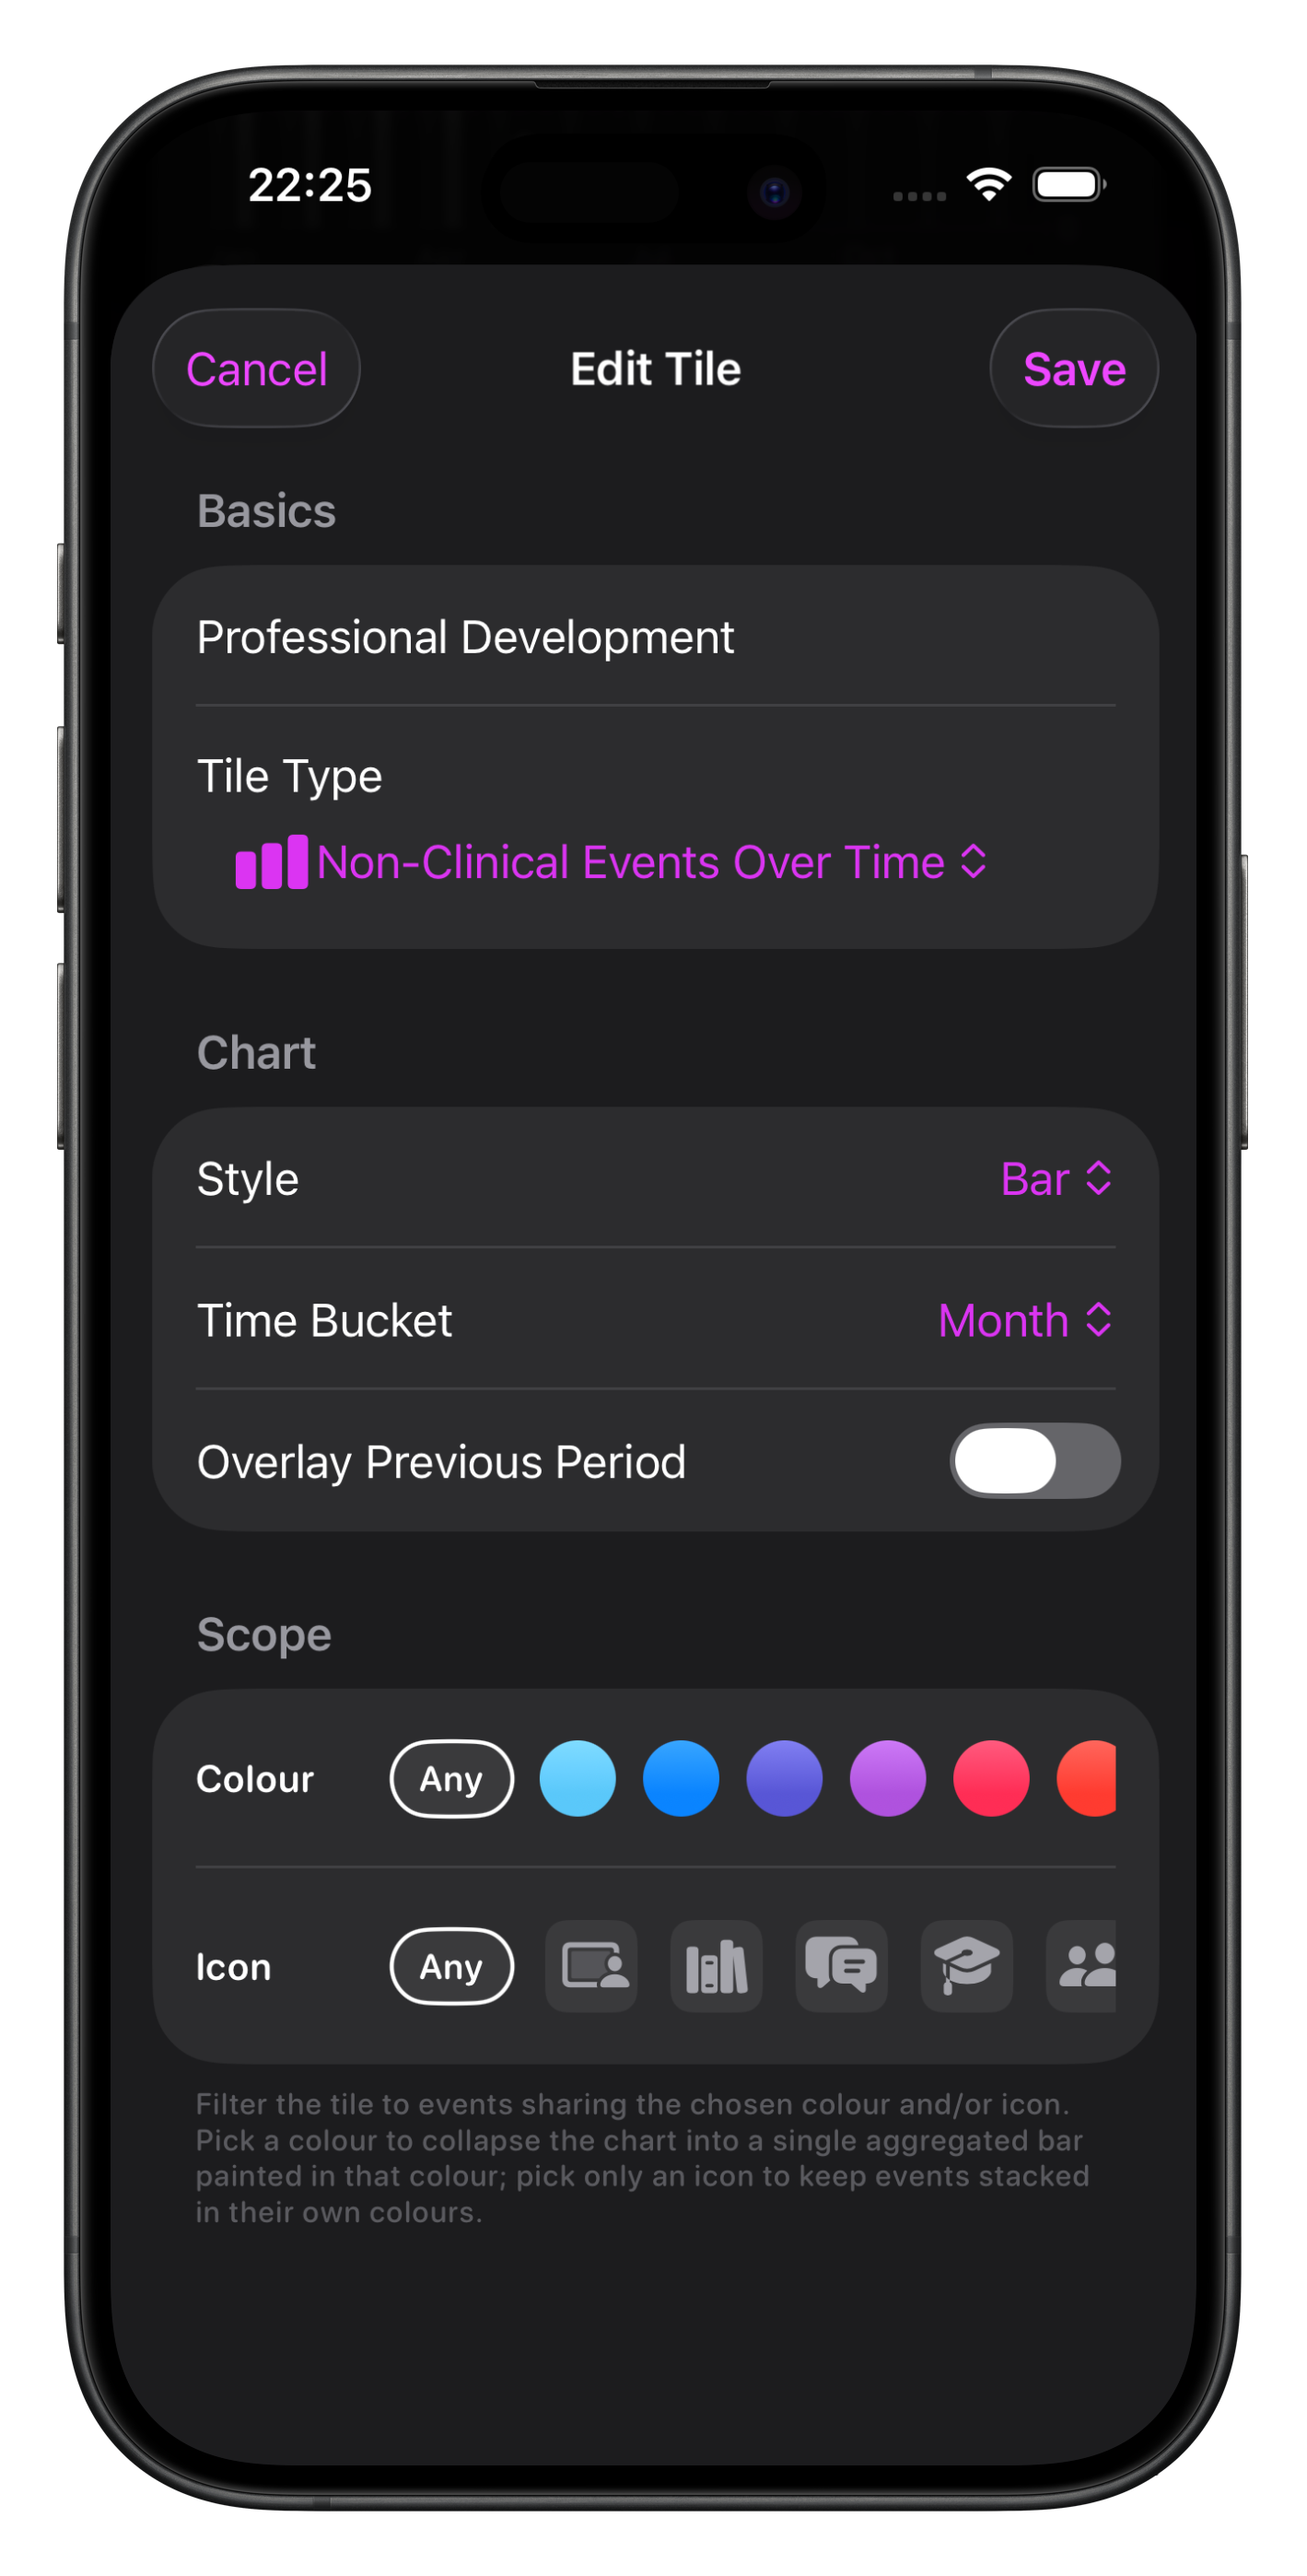
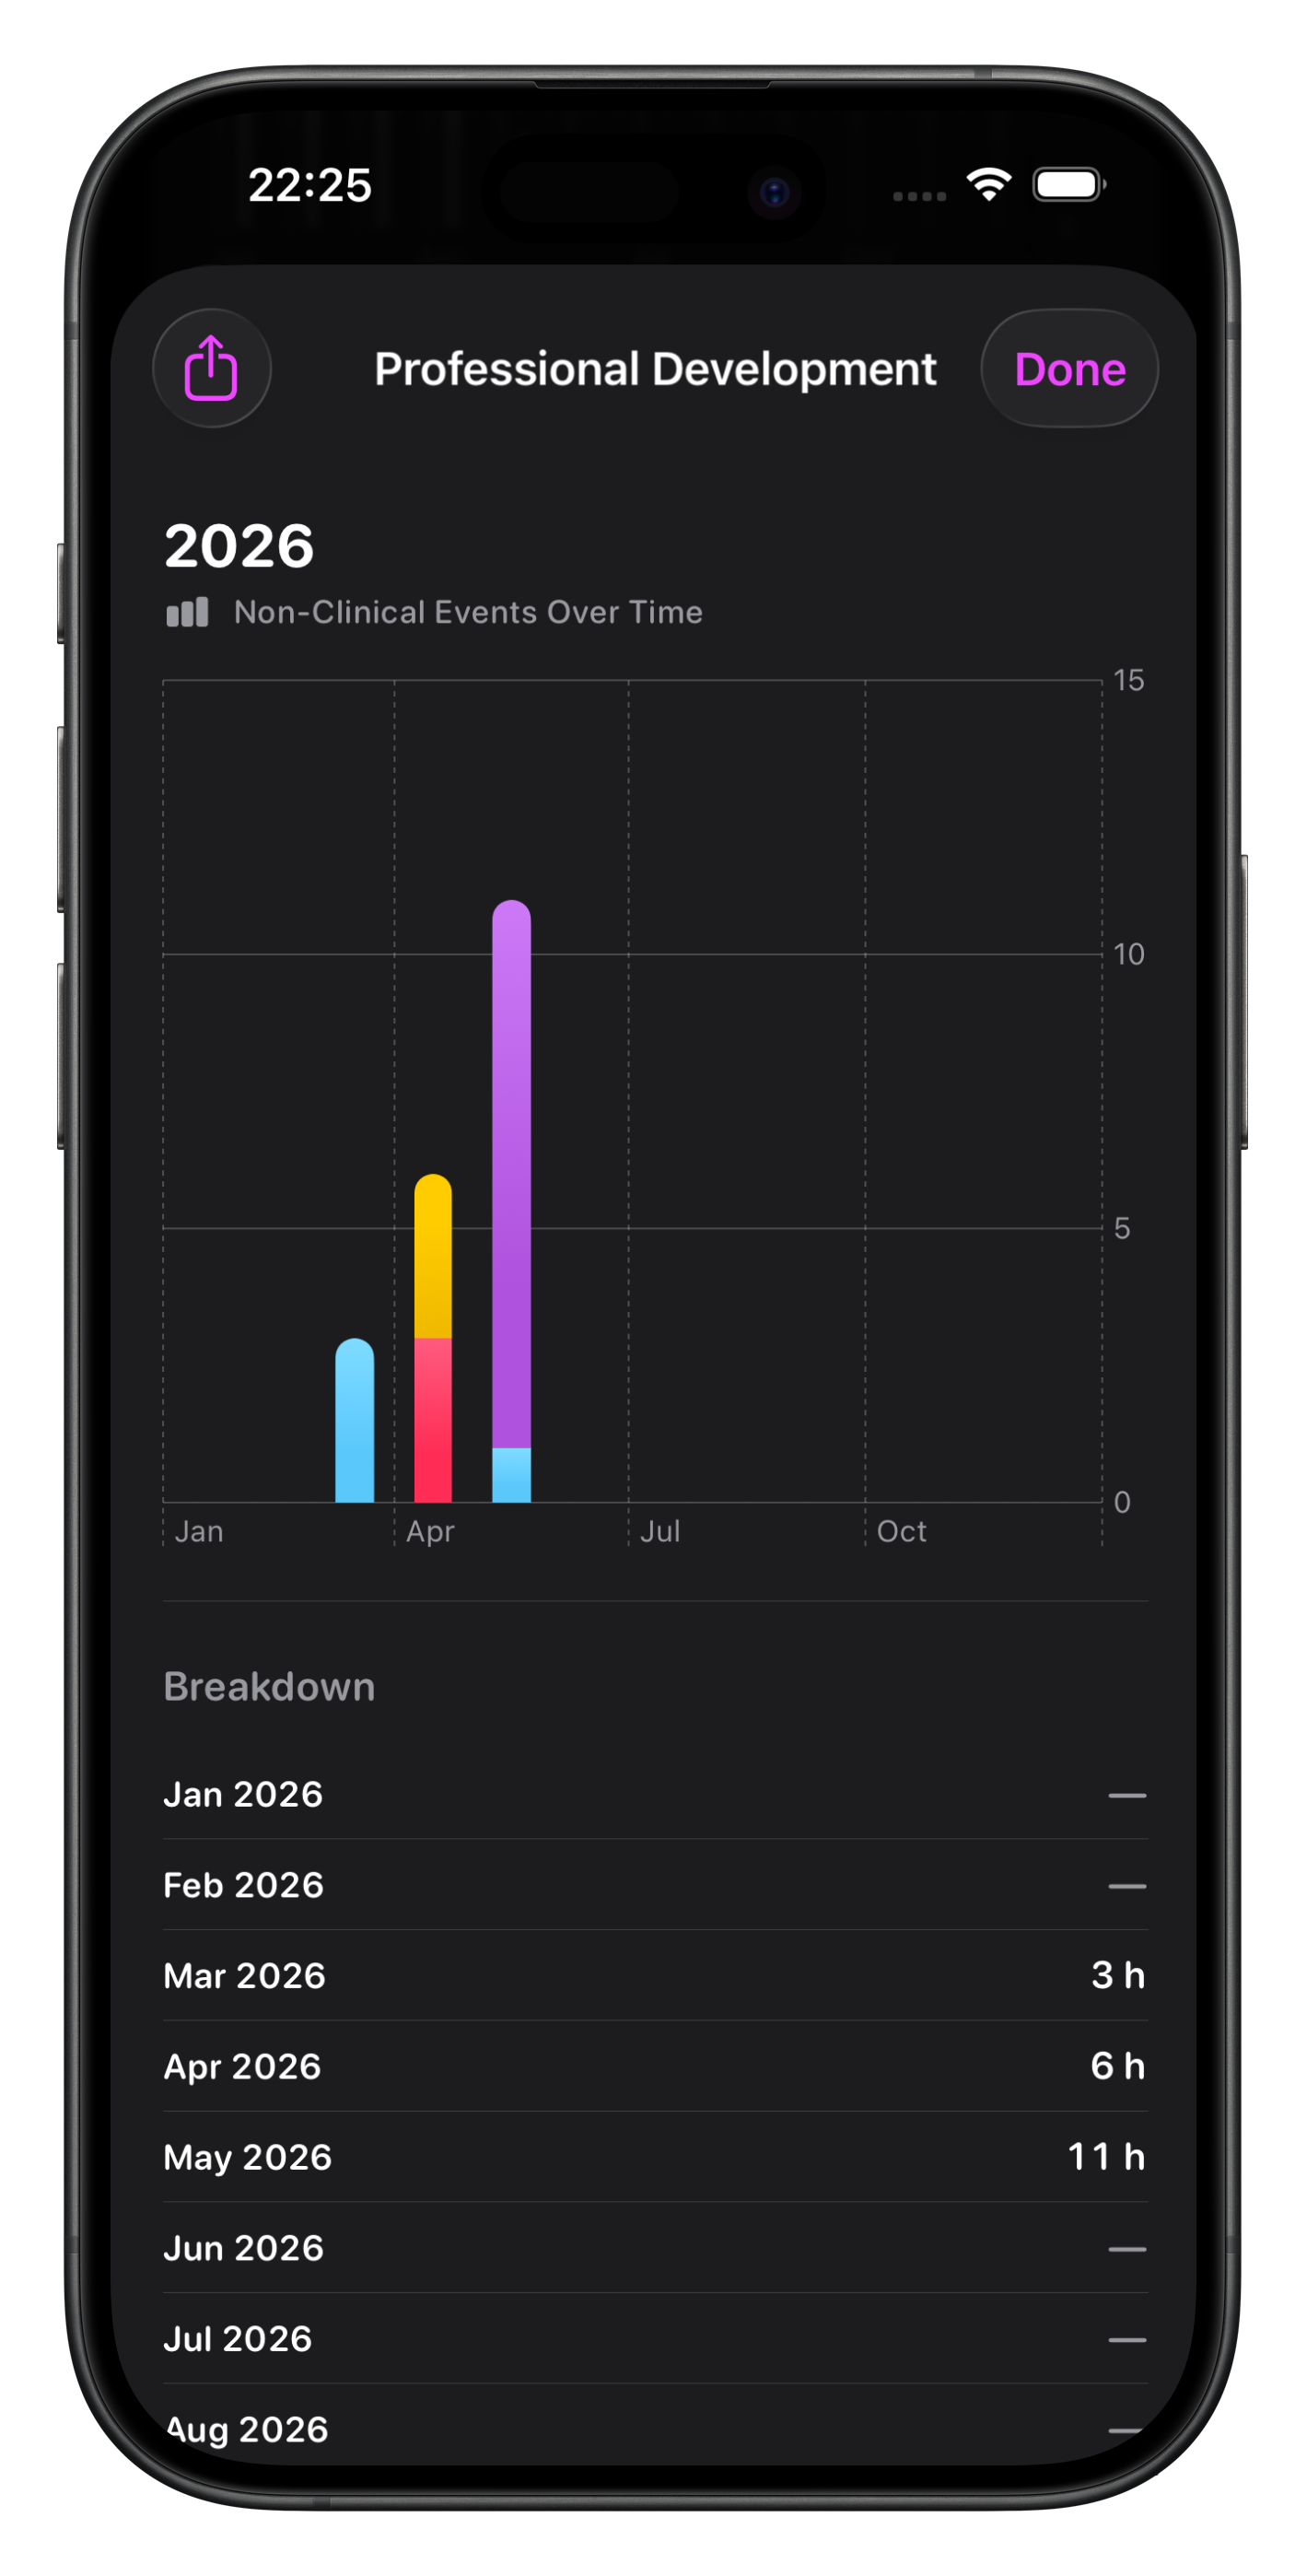
Non-Clinical Events Over Time
This chart allows you to visualise your non-clinical event hours over time with the ability to overlay the previous period & adjust the time bucket.
Filter by colour or icon so you can group non-clinical events for reporting.
Exporting from the detail view will allow you to export all grouped items as a formatted PDF.

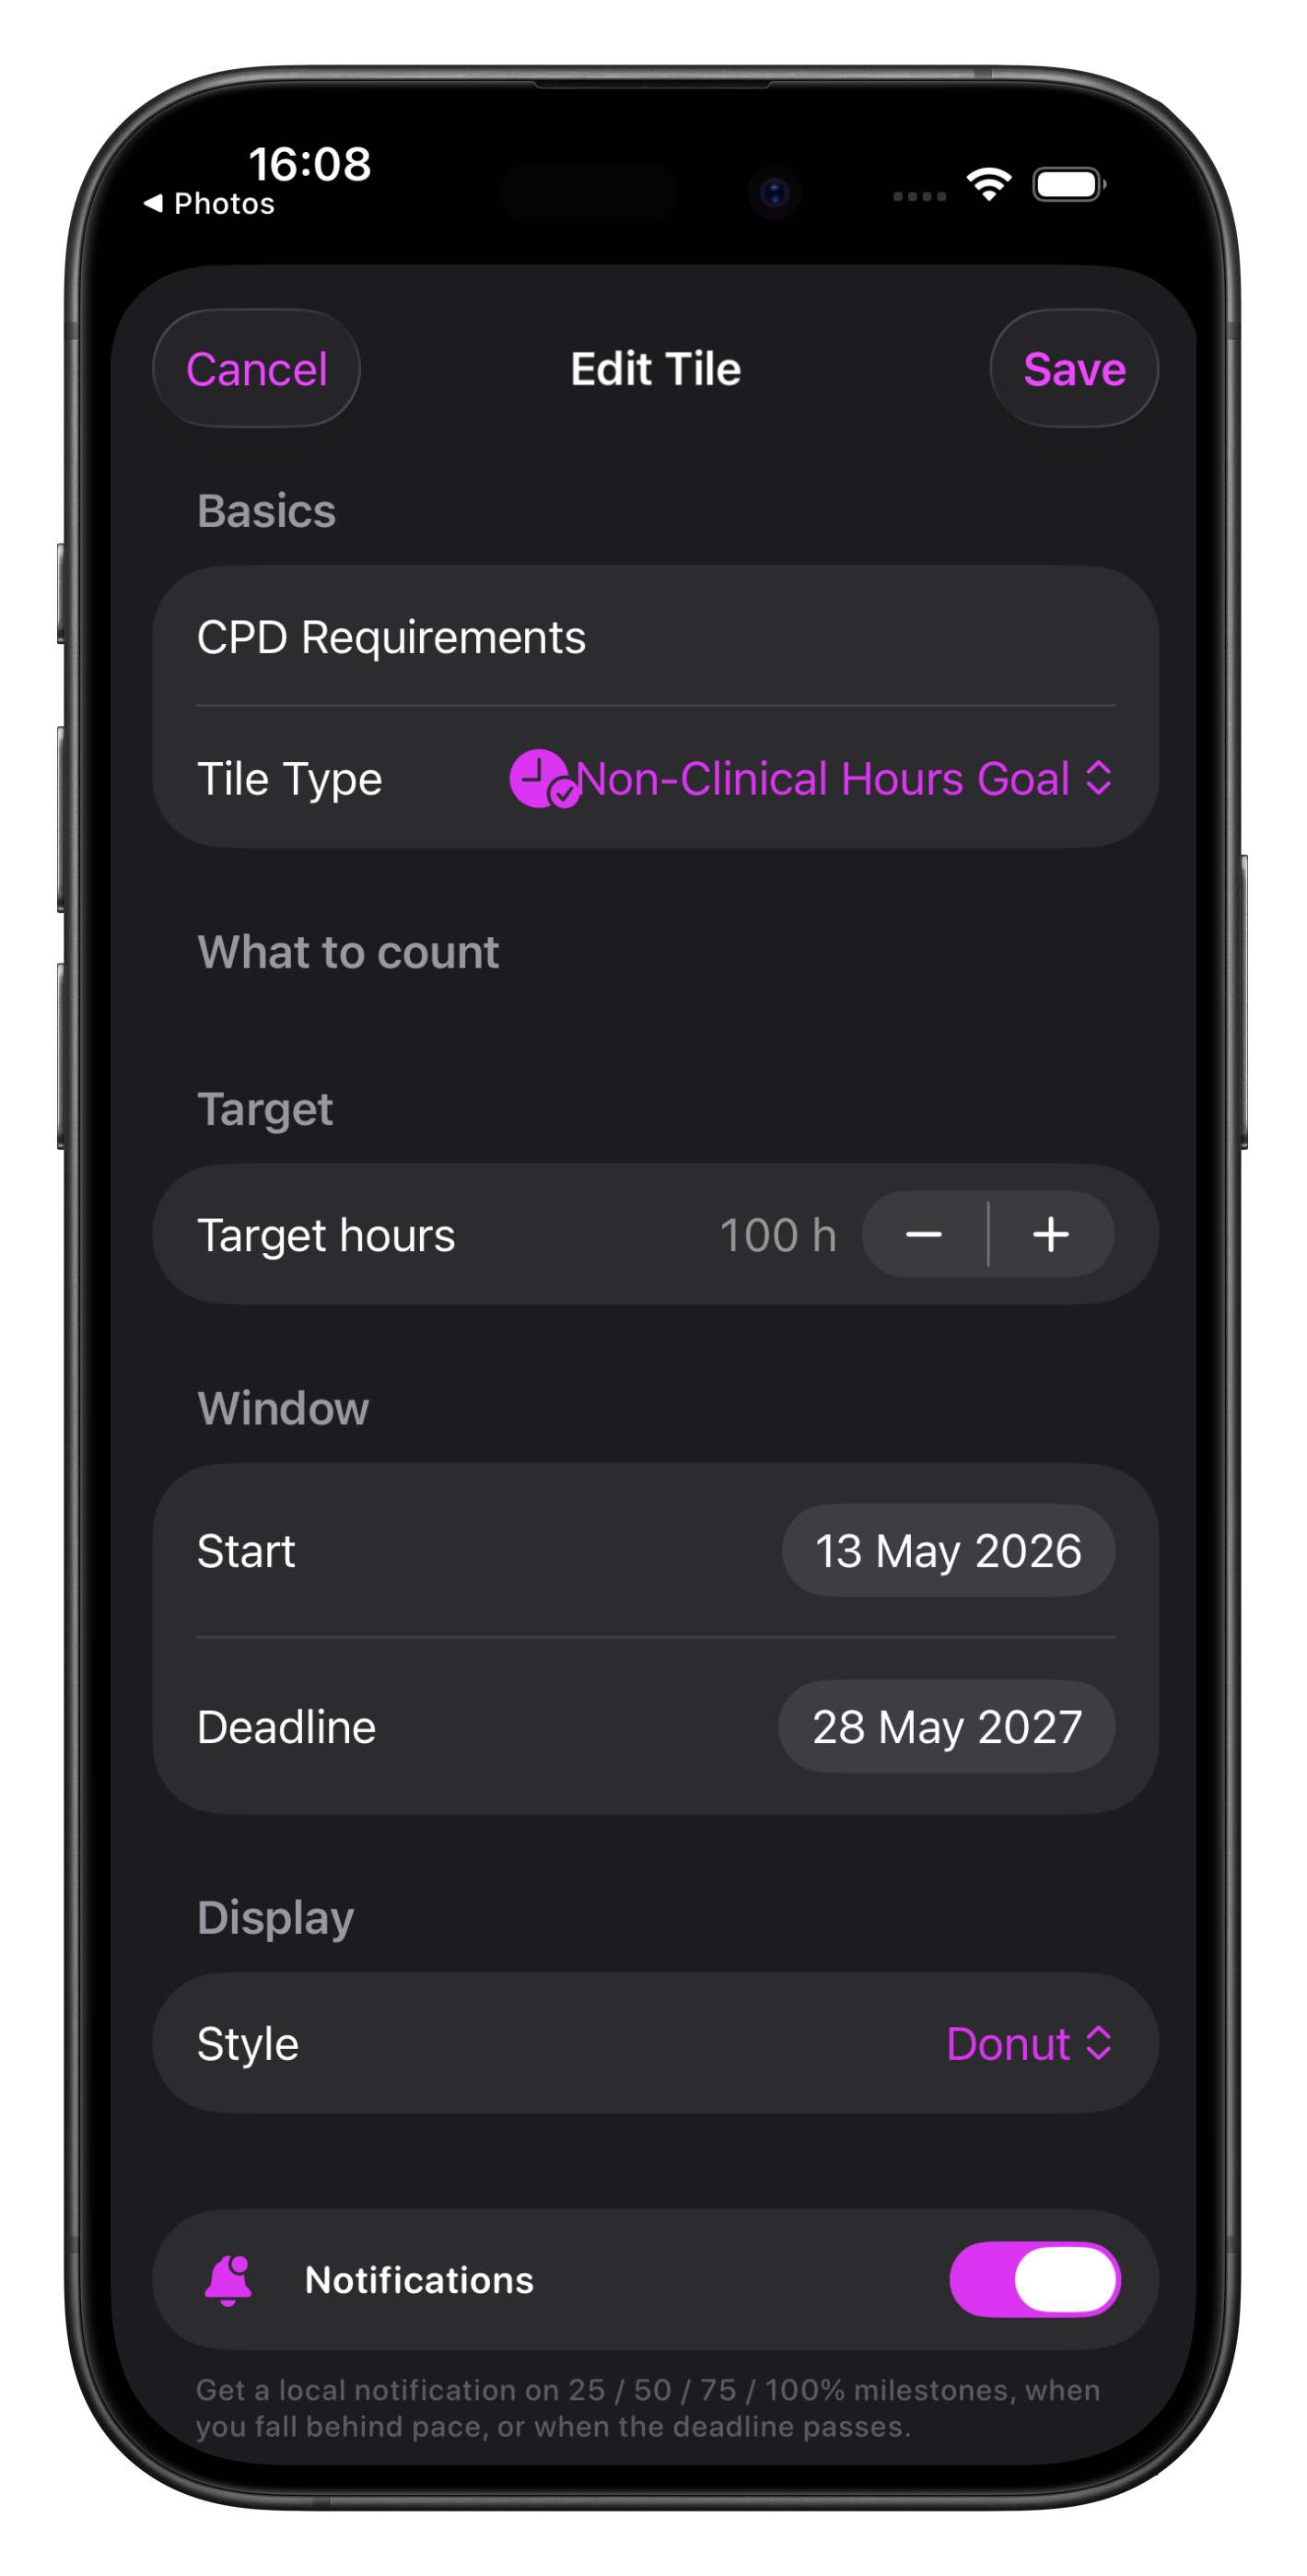
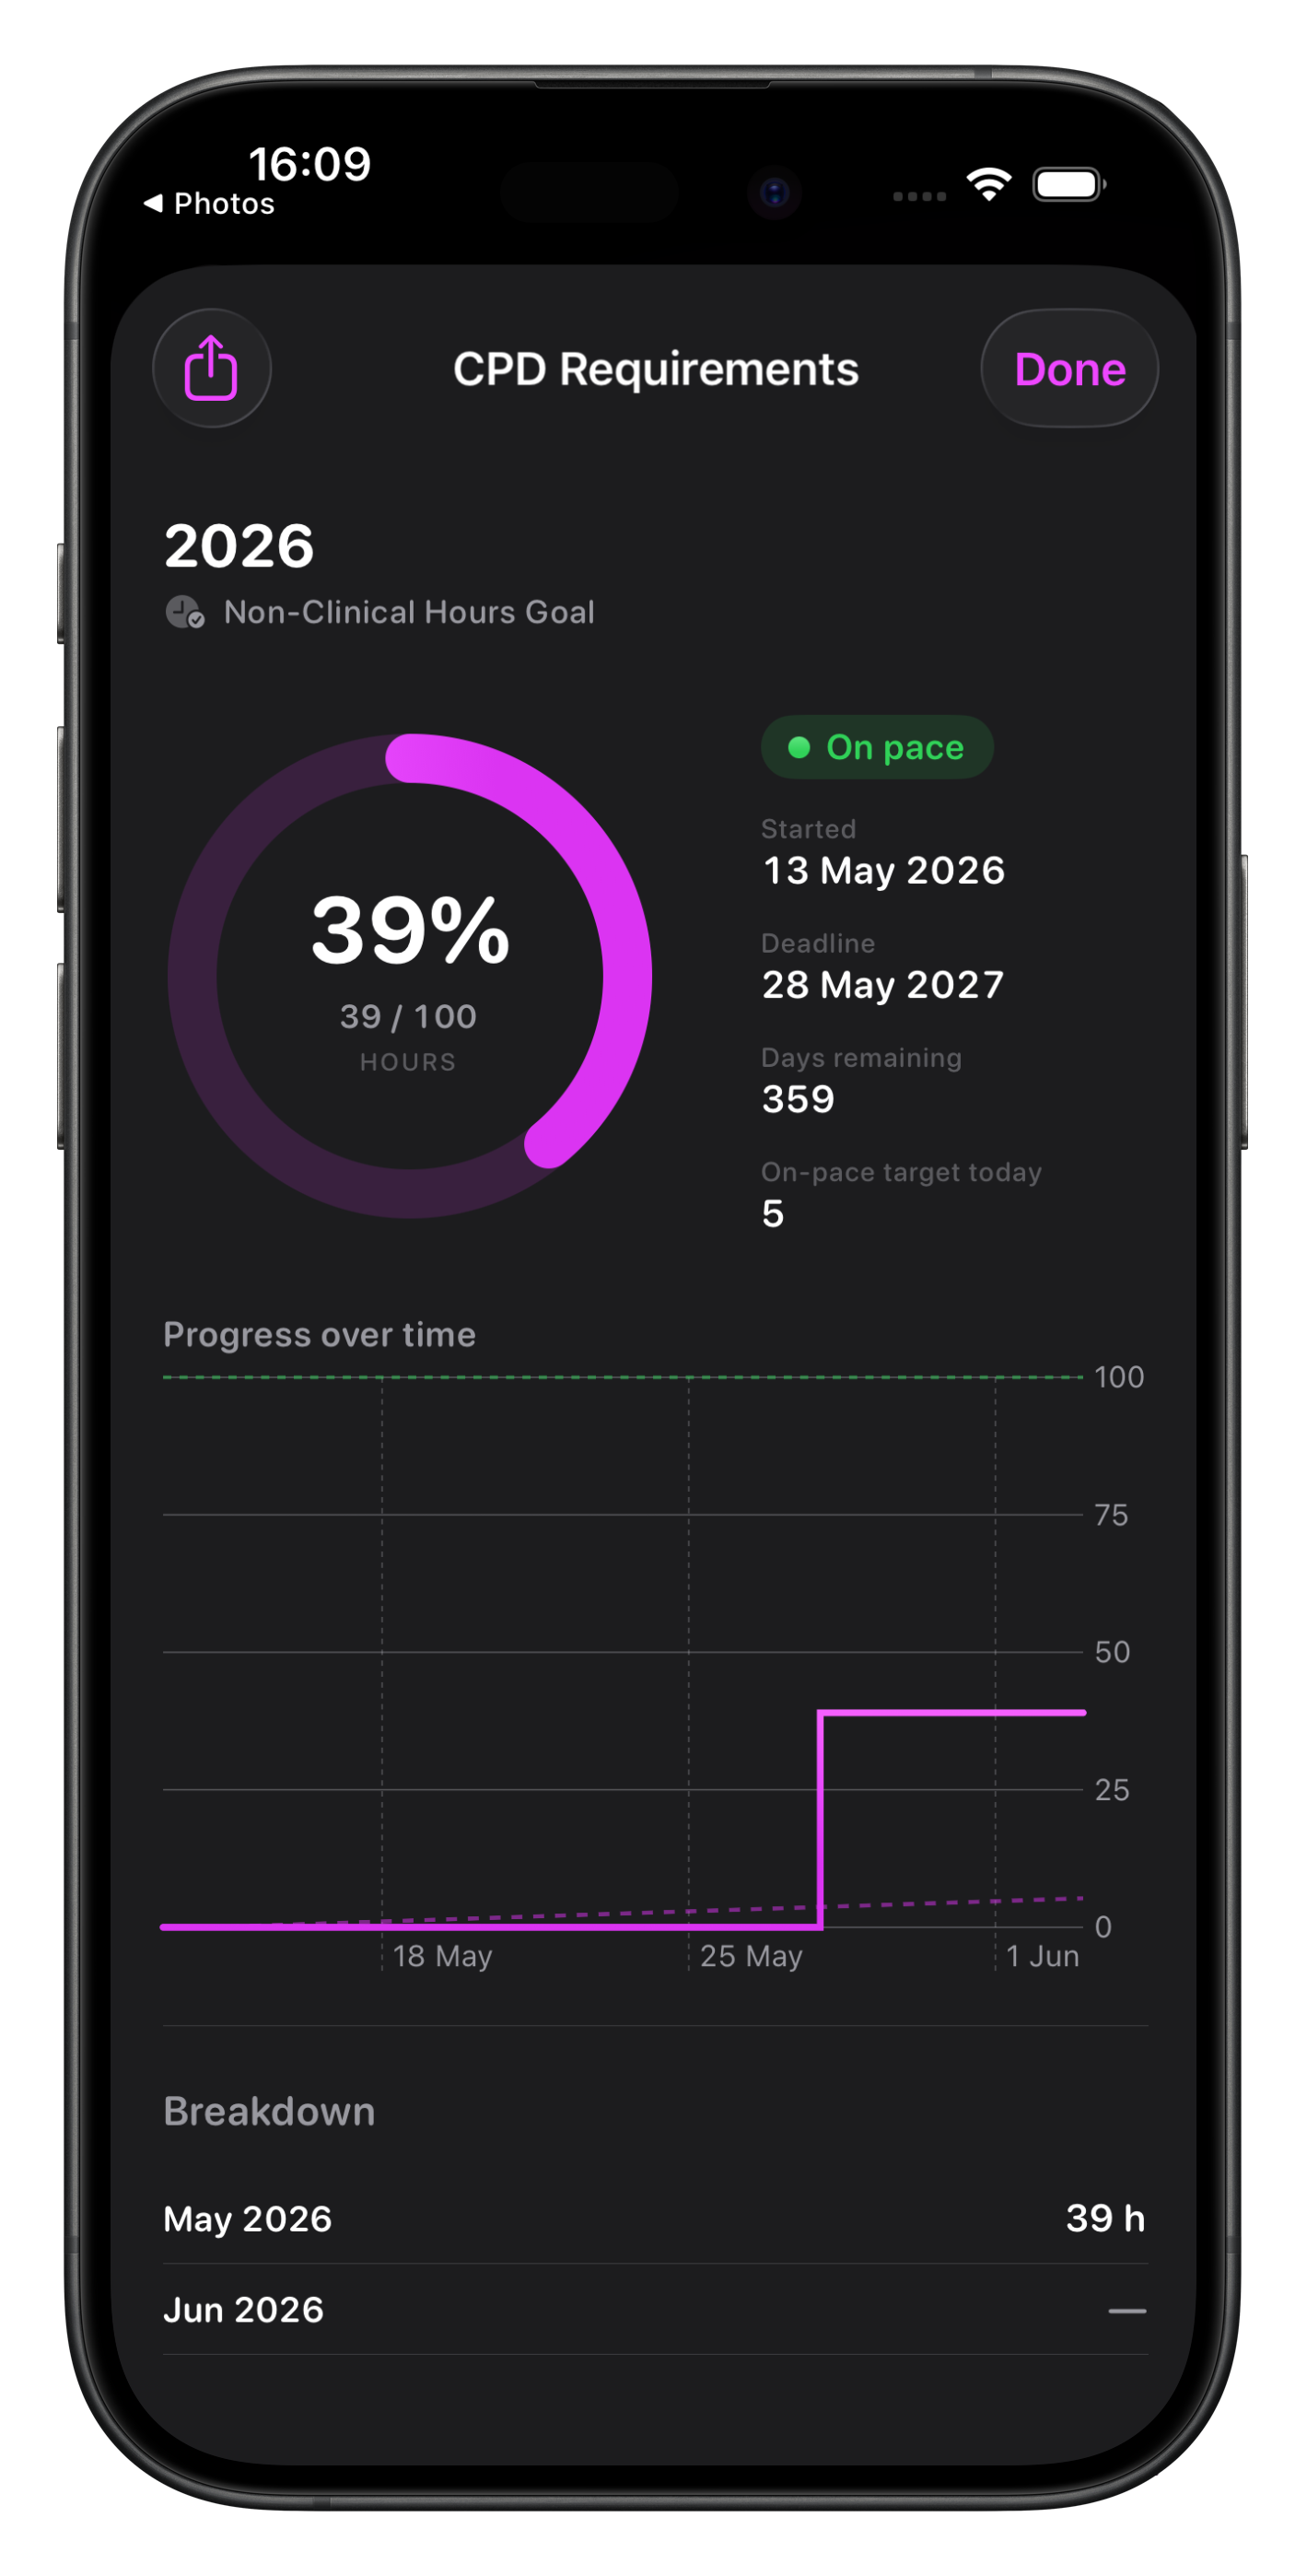
Non-Clinical Hours Goal
Similar to the Goal chart for Cases, the Non-Clinical Hours Goal chart differs in that the metric being measured is hours, rather than event counts.
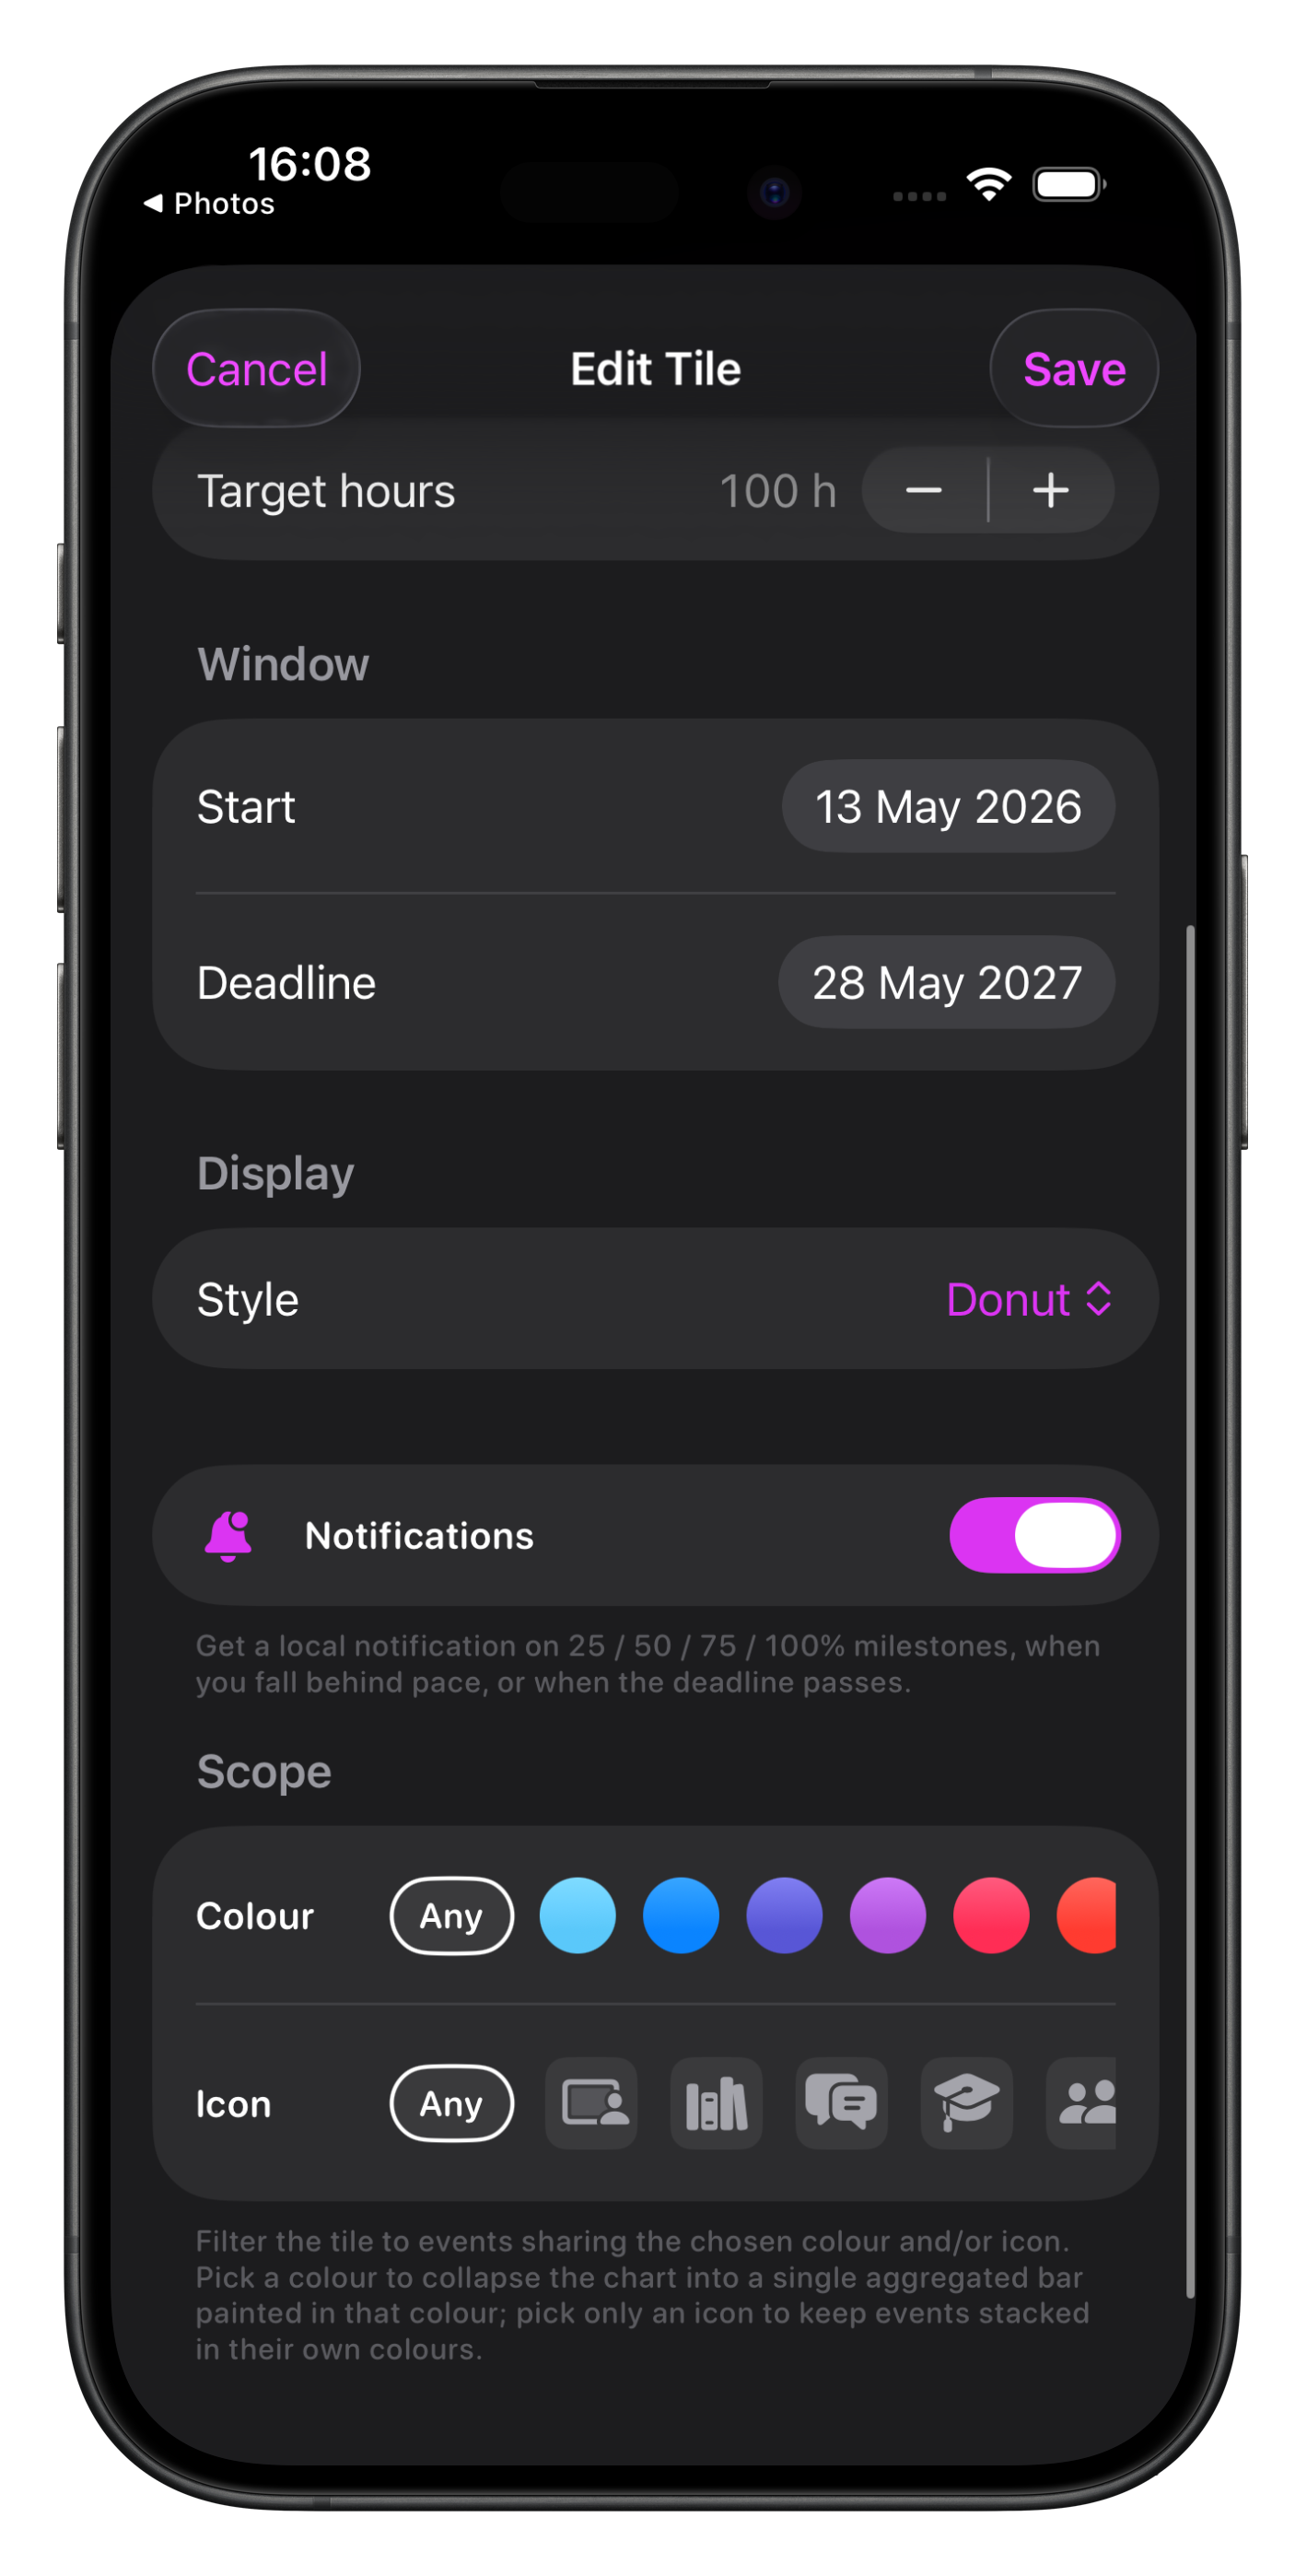
The settings are similar except for the filtering scope options, where you can filter by colour or icon.
This is the primary way to group non-clinical events as well.