Generating Reports
Any individual Case and any list of Cases can be exported (see here) into several file formats, using menus:
These are text-only comma separated value files which you can open in a spreadsheet application like Apple Numbers or Microsoft Excel
Three options are available:
Spreadsheet
Summary Report
MyPortfolio spreadsheet for Australian Users
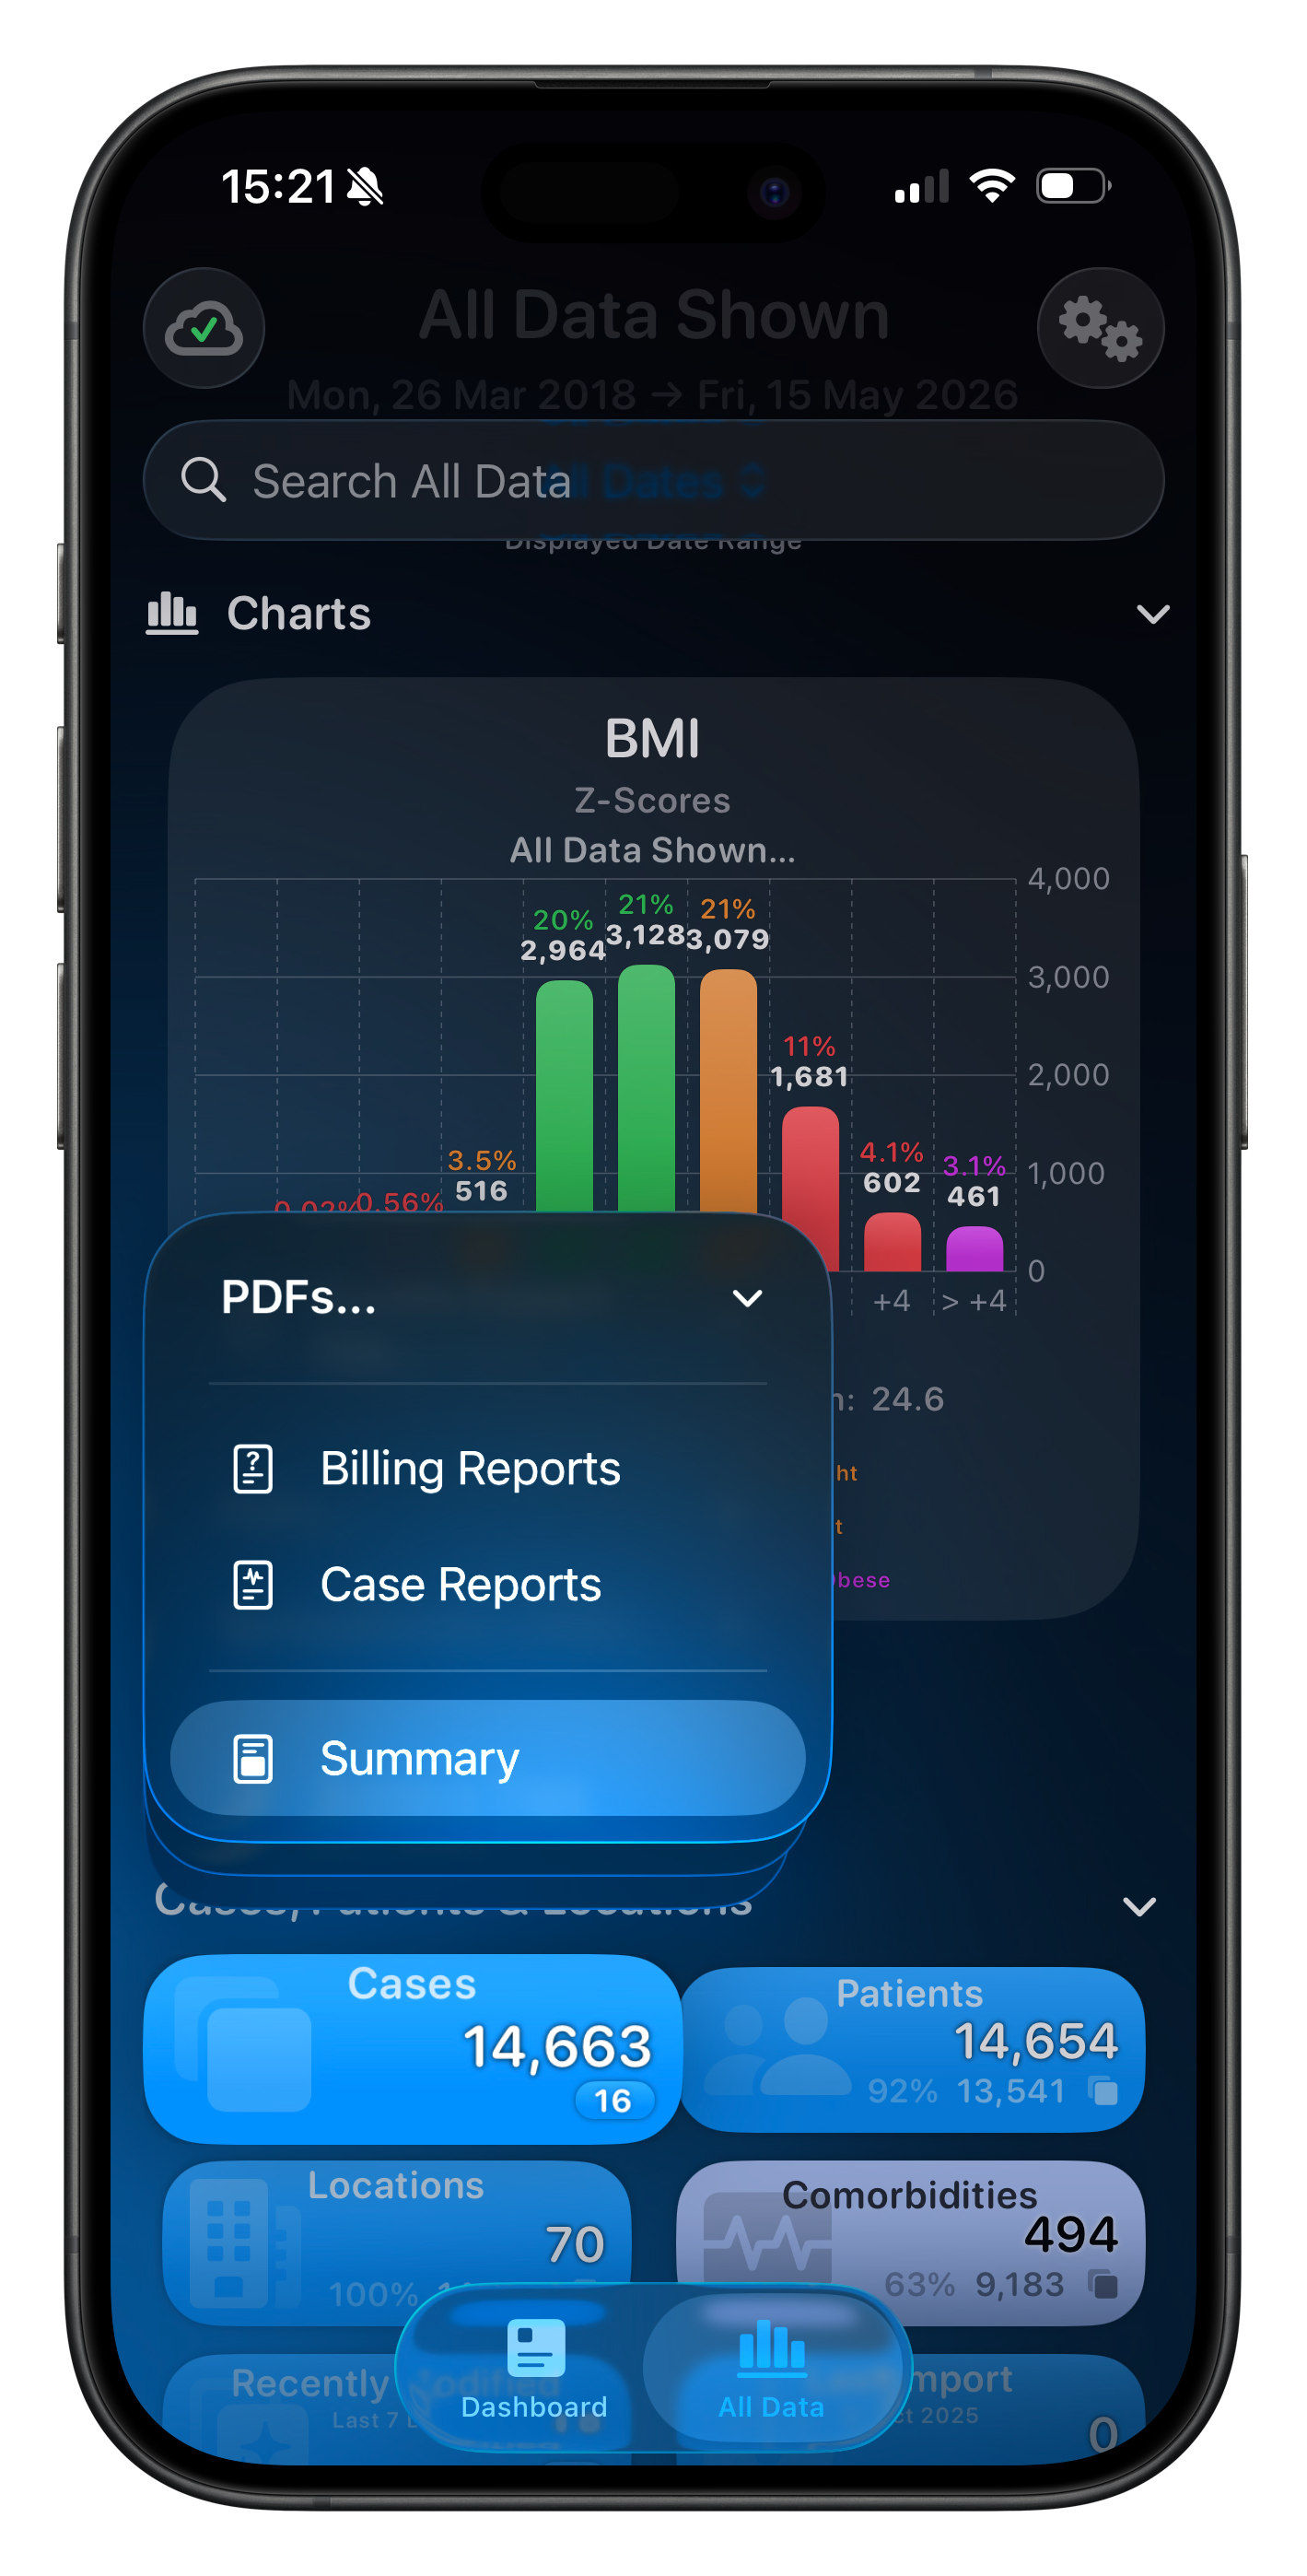
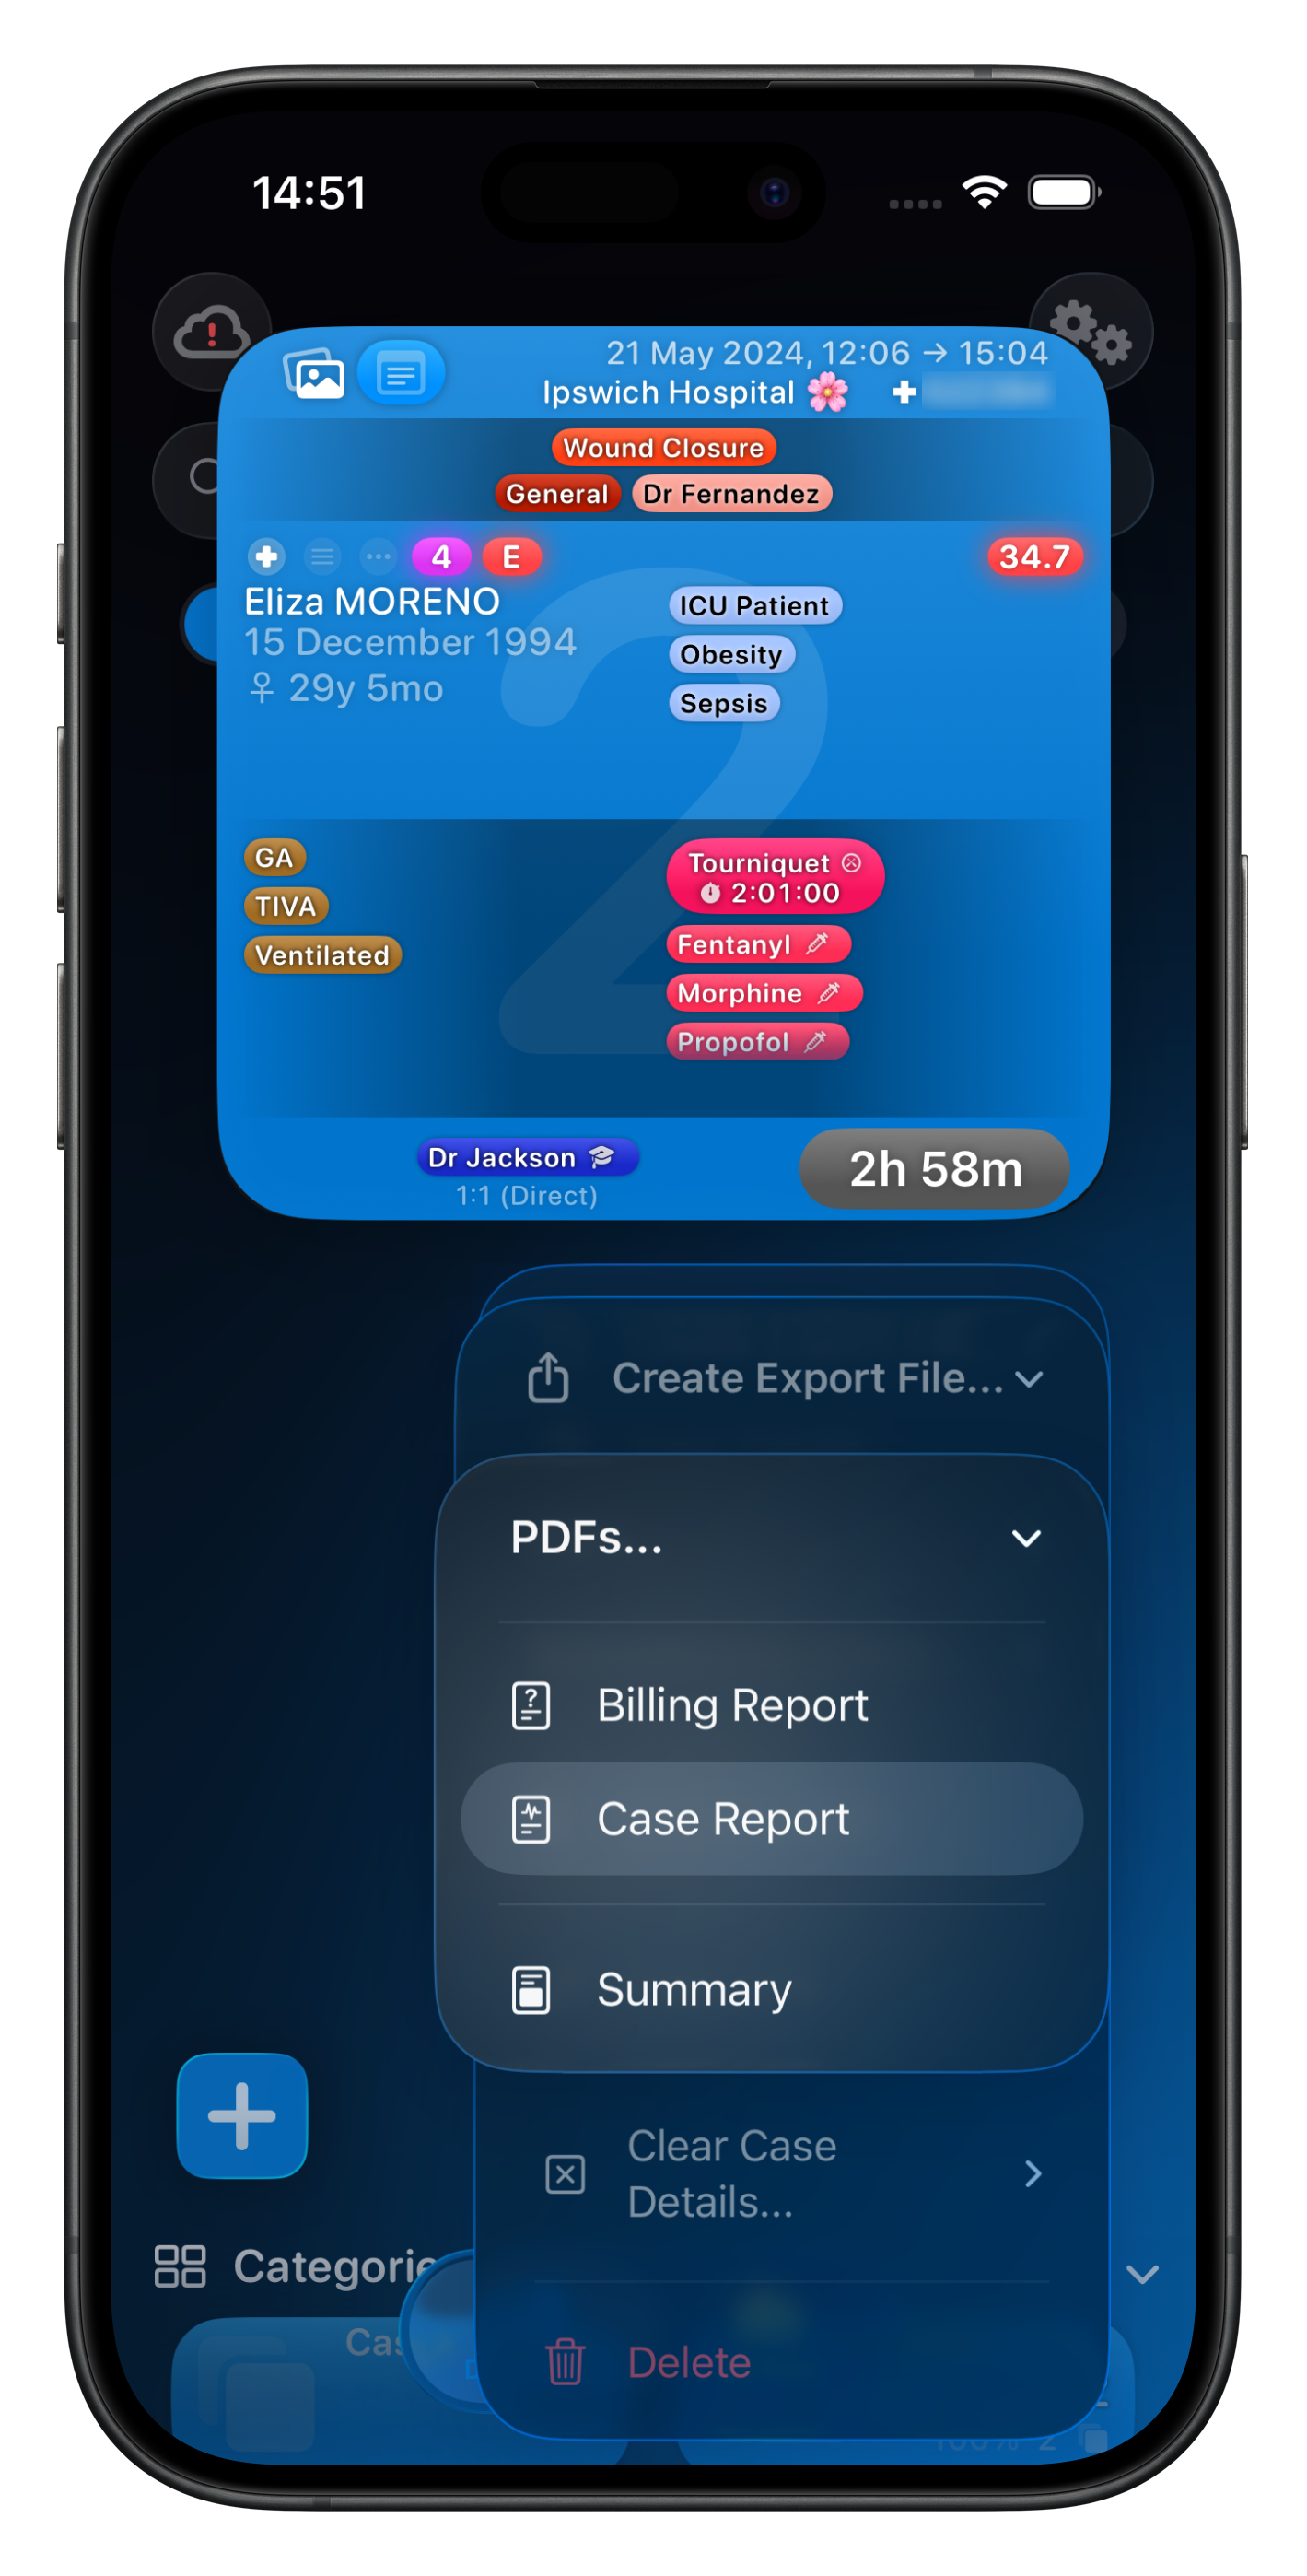
PDFs
These are rich text PDF files which include (where applicable) patient labels, clinical photos, deep links & charts.
Three options are available:
Summary Report
Case Reports
Billing Reports
Theatre List Report (When viewing Cases in ‘Day’ mode)


Quick Filtering Cases For Export
In Somnus, tapping any category Item will show a list of all Cases linked to that Item. From there it’s easy to export these Cases for reporting or auditing purposes.
For example, viewing Comorbidities via the Summary Tile on the All Data screen will list All Comorbidities.
Tapping one (eg. Smoker), will show all Cases that have the Comorbidity ‘Smoker’ attached to them. Use the menu to export the file, adding an optional report name.
🔥 If the data displayed in lists is bounded by a date range (eg. viewing data for a specific Year on the All Data or Dashboard screens), the Cases linked to that item will also be restricted to that date range. This makes for even more powerful rapid filtering.


Spreadsheets (CSV)
Two types of CSV Files are available:
Standard Spreadsheet
This will present each case in a row with columns for every data point entered into Somnus
You can optionally choose to show/hide identifiable patient information if you need anonymised data (see Security & Privacy in Settings)
Summary Report
This is a spreadsheet summary with counts of each category item for the exported Cases
To show/hide which categories appear in these Summary Reports (also applies to PDF Summaries), see Reports in Settings.
🔥 A standard spreadsheet file is a great way to further analyse your data outside of Somnus particularly if you’re savvy with spreadsheet applications.
It’s also a great way to have all your data in a format that is completely platform agnostic.
NOTE: You won’t see labels & images exported in these spreadsheets.


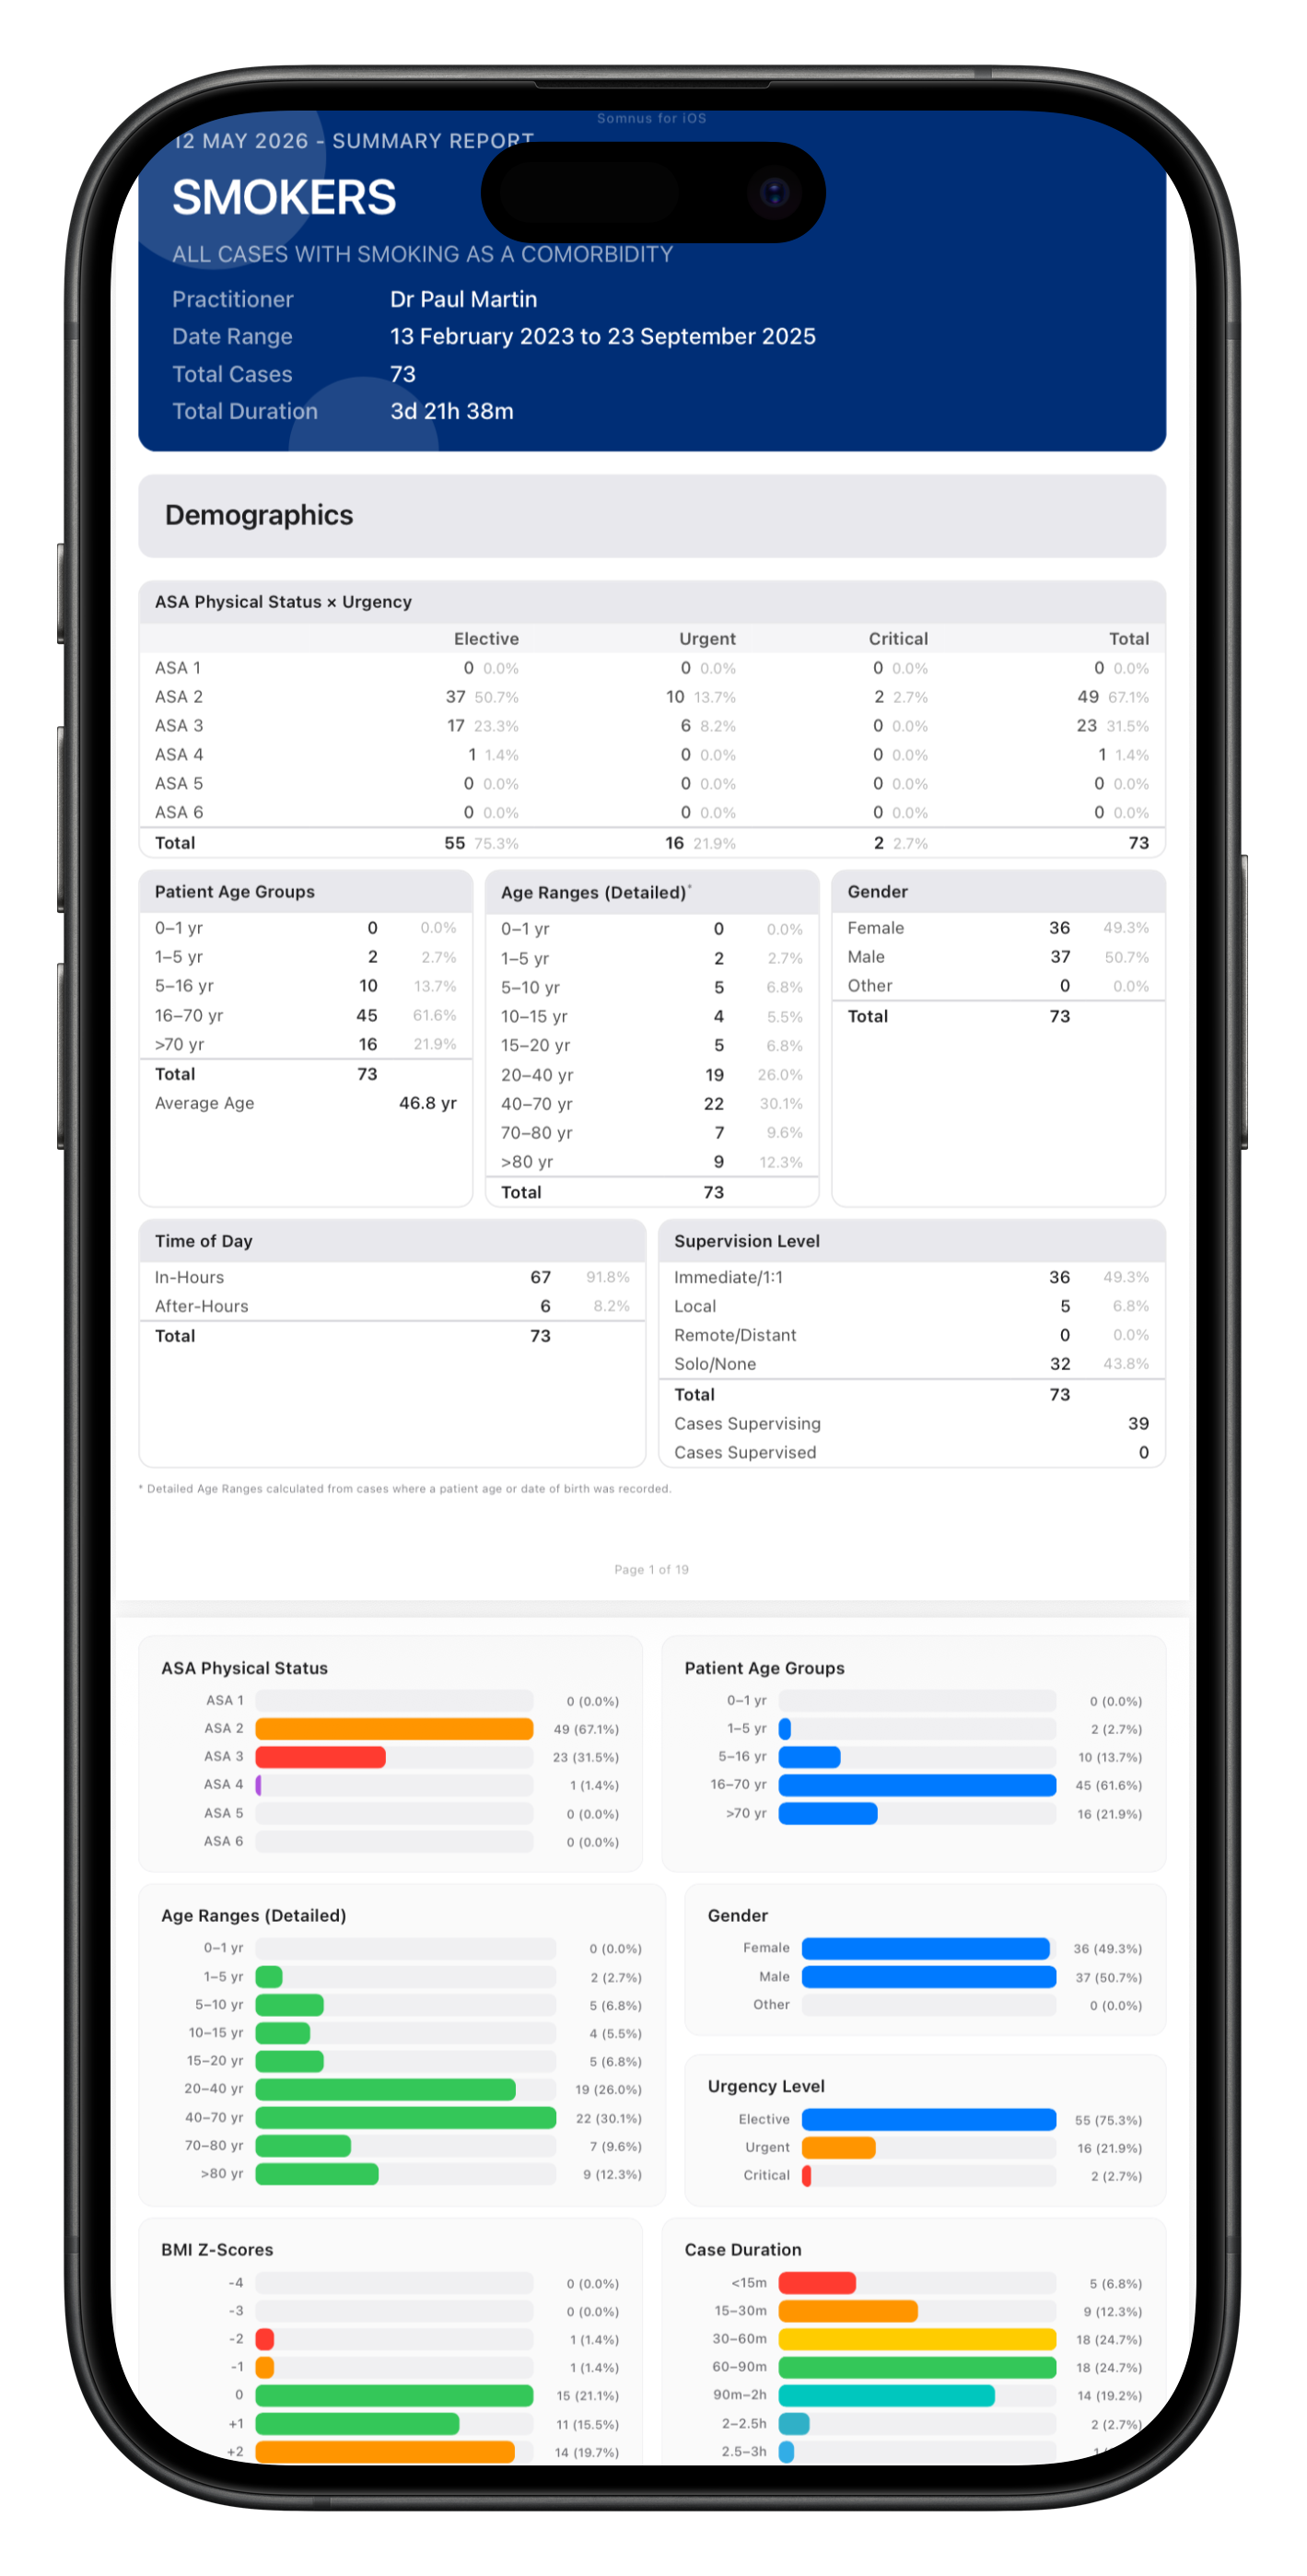
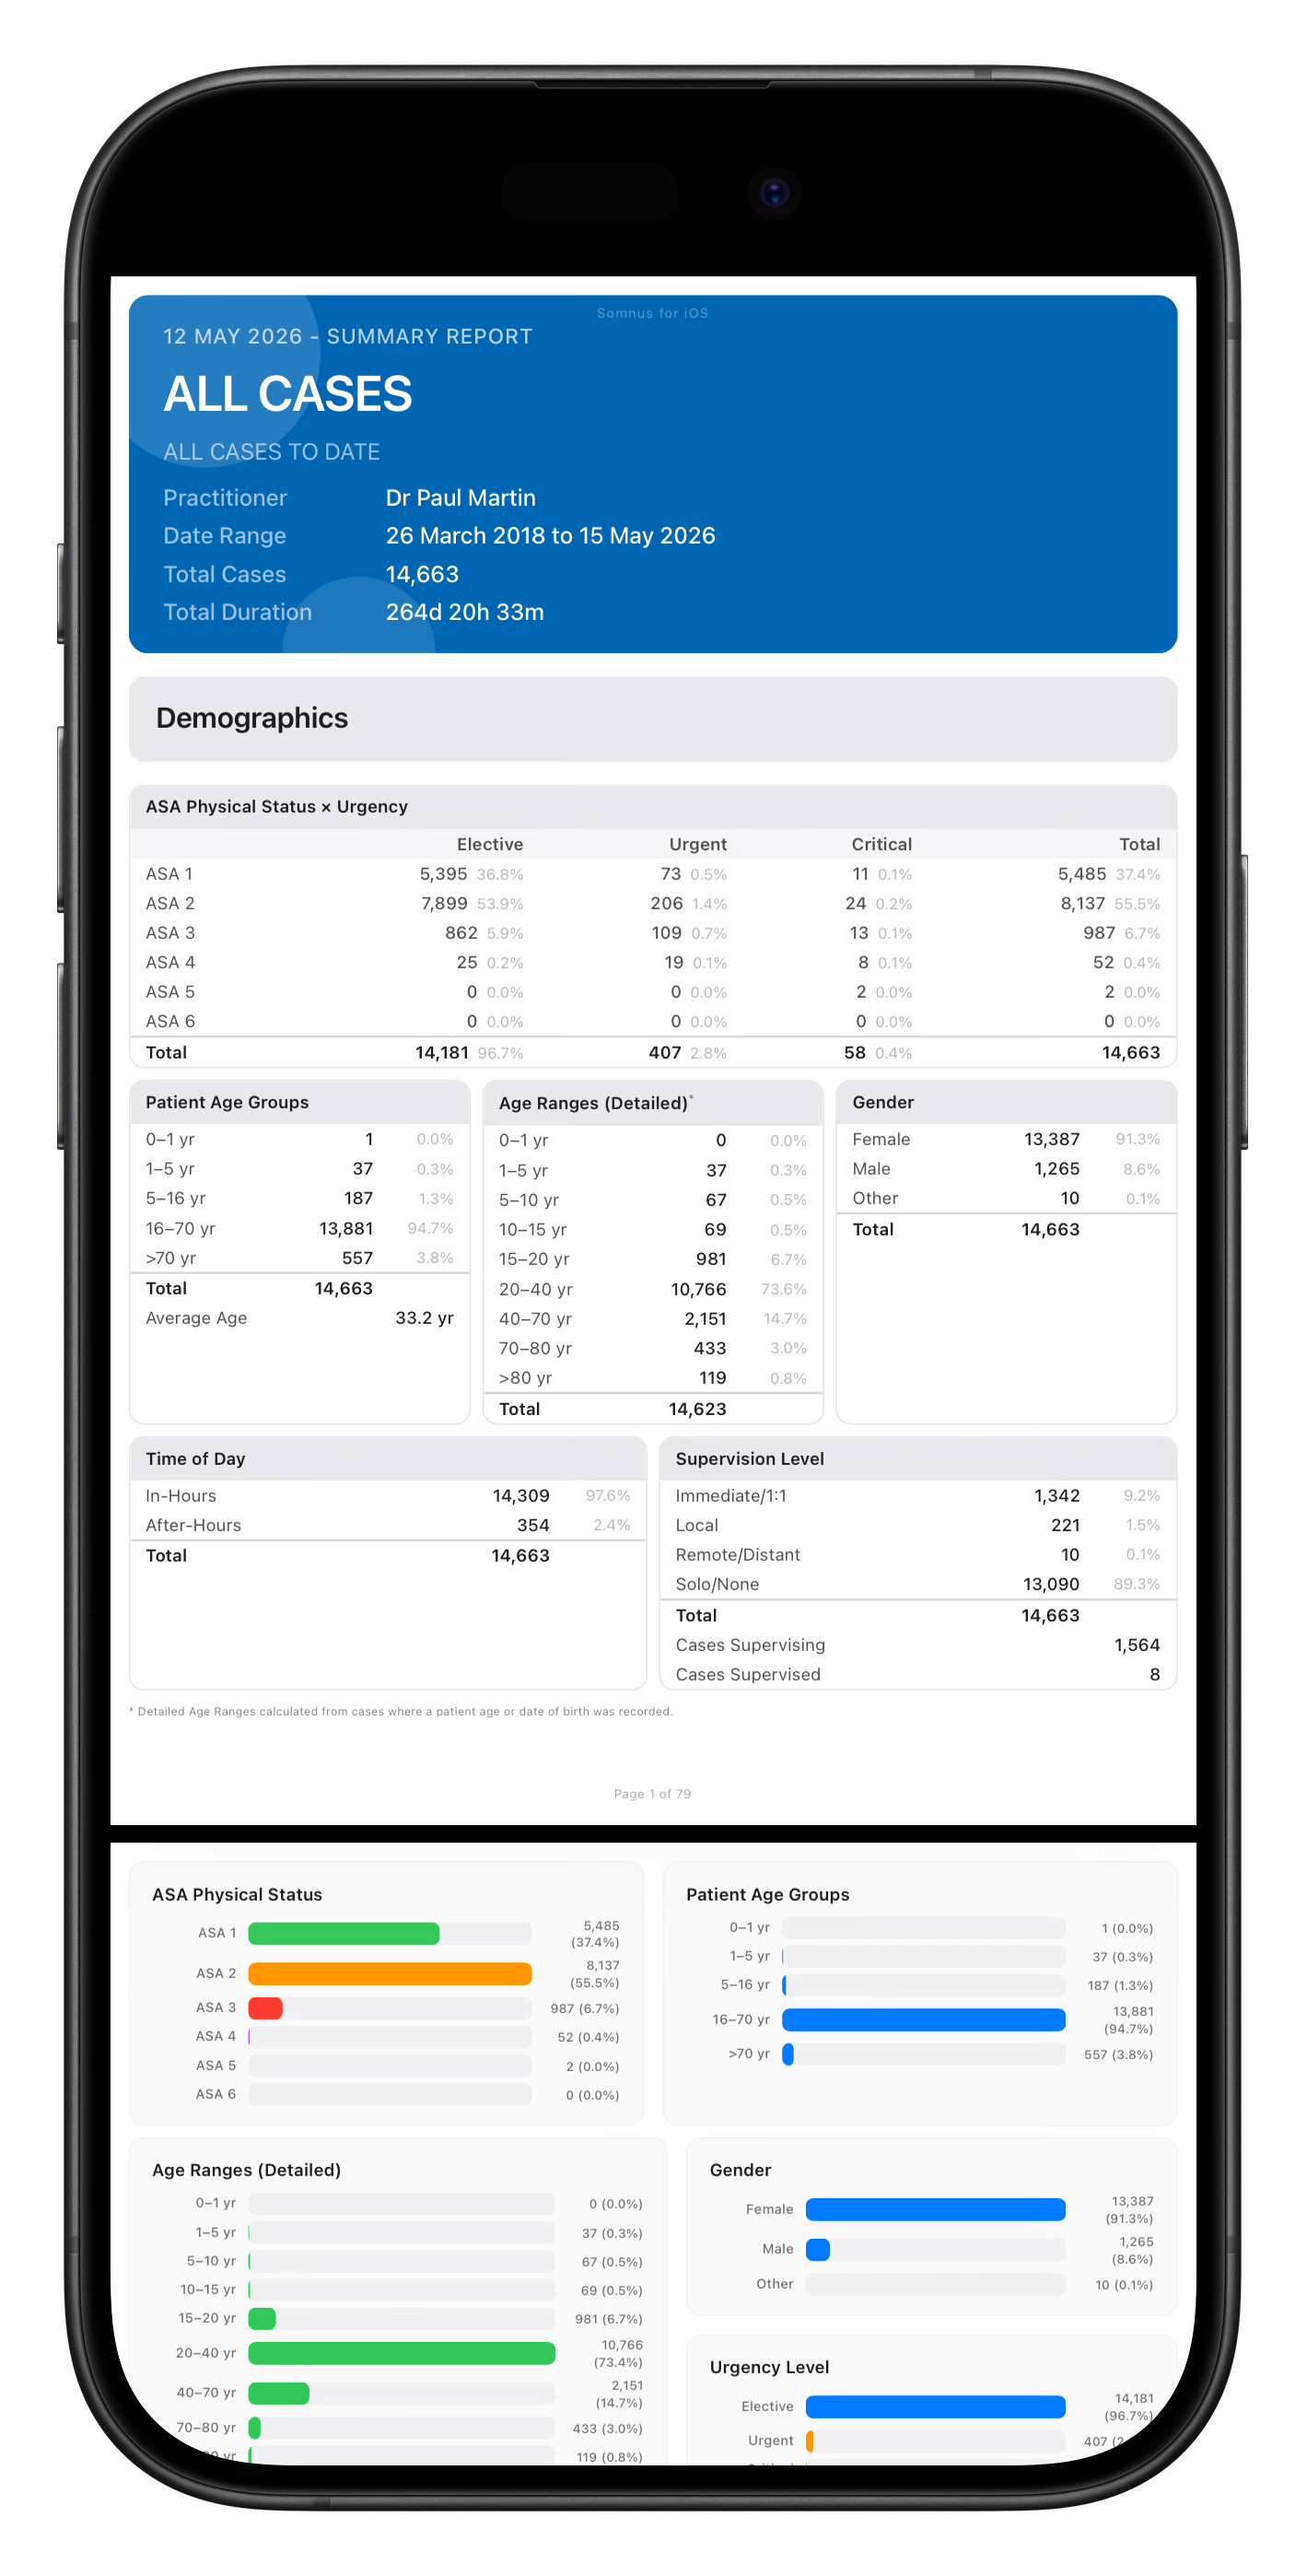
Summary Report (PDF)
Turn your caseload into a comprehensive, visual overview with a single export. Summary reports analyse all your cases across a chosen date range and present the key patterns in a polished, print-ready PDF — perfect for training portfolios, performance reviews, or simply understanding your practice at a glance.
Each report includes detailed demographic breakdowns — patient age distributions, gender, ASA physical status, urgency levels, and BMI — alongside operational insights like case duration distribution, in-hours versus after-hours work, and supervision levels. Interactive-style bar charts make it easy to spot trends across every dimension.
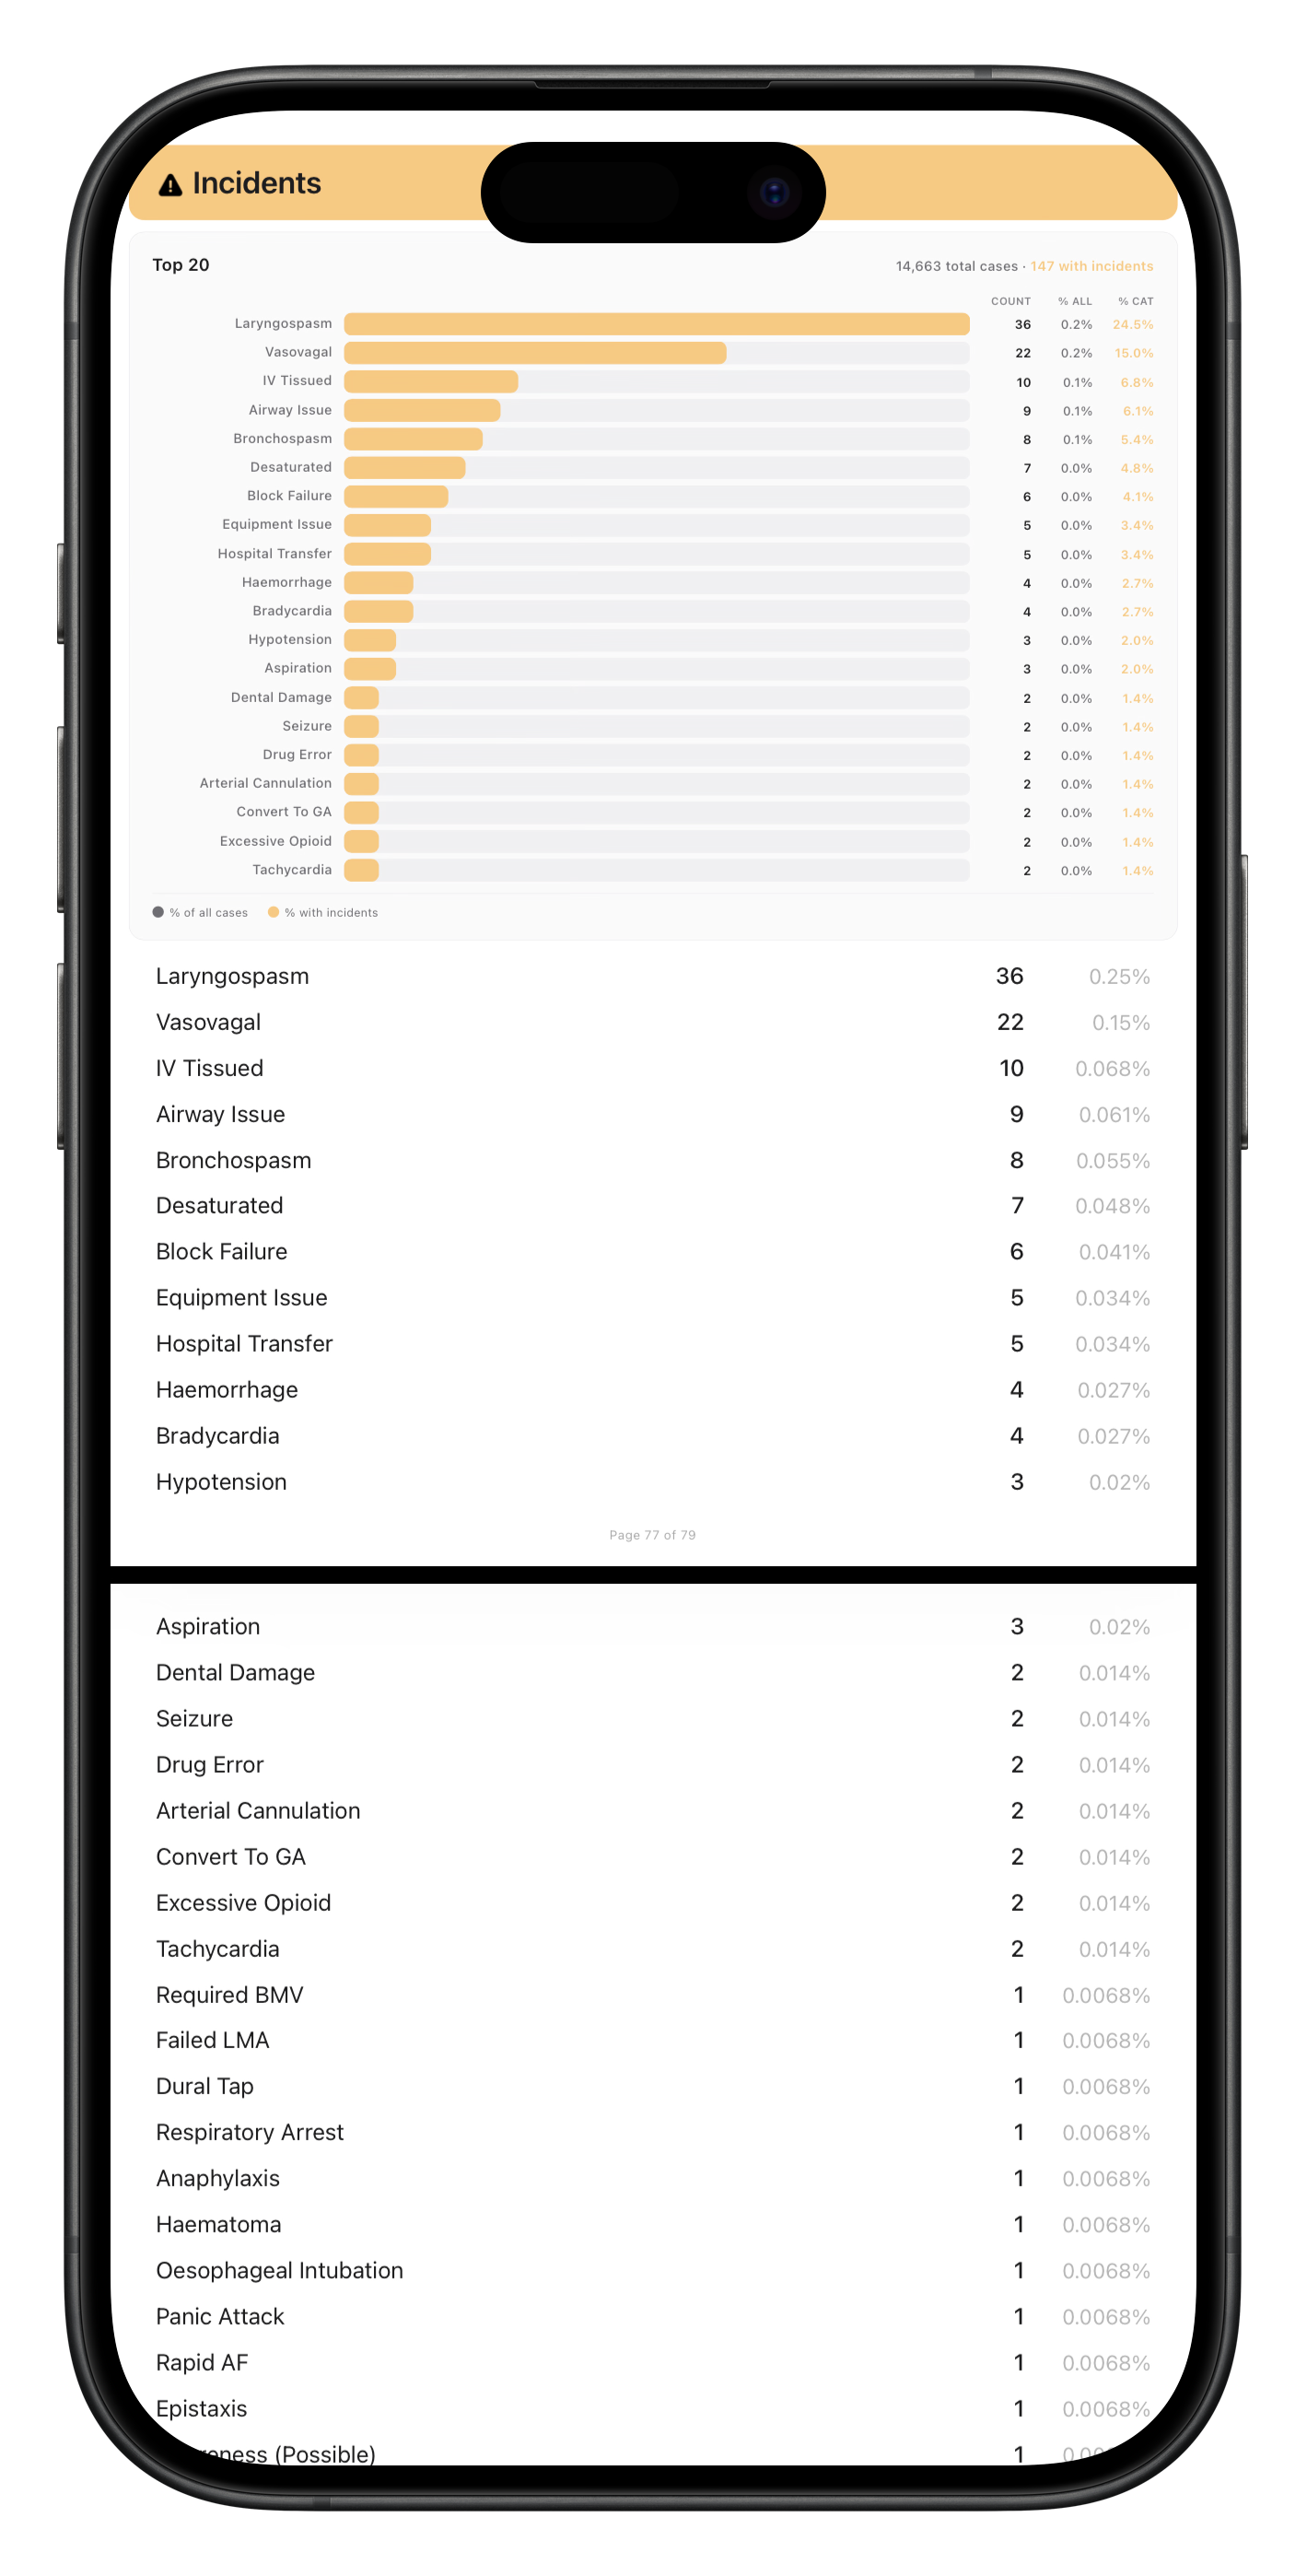
Your cases are broken down by specialty and operation, with nested listings showing exactly how your time is distributed. The report also covers procedures, surgeons, locations, comorbidities, incidents, trainees, and any custom item lists you've created — each with counts, percentages, and visual charts showing your most common entries.
In Settings, choose to sort by frequency or alphabetically, and toggle individual sections on or off to tailor the report to your needs.
Customise the title, subtitle, date range, and highlight colour to match your branding, then share the PDF with colleagues, supervisors, or training bodies directly from the app.
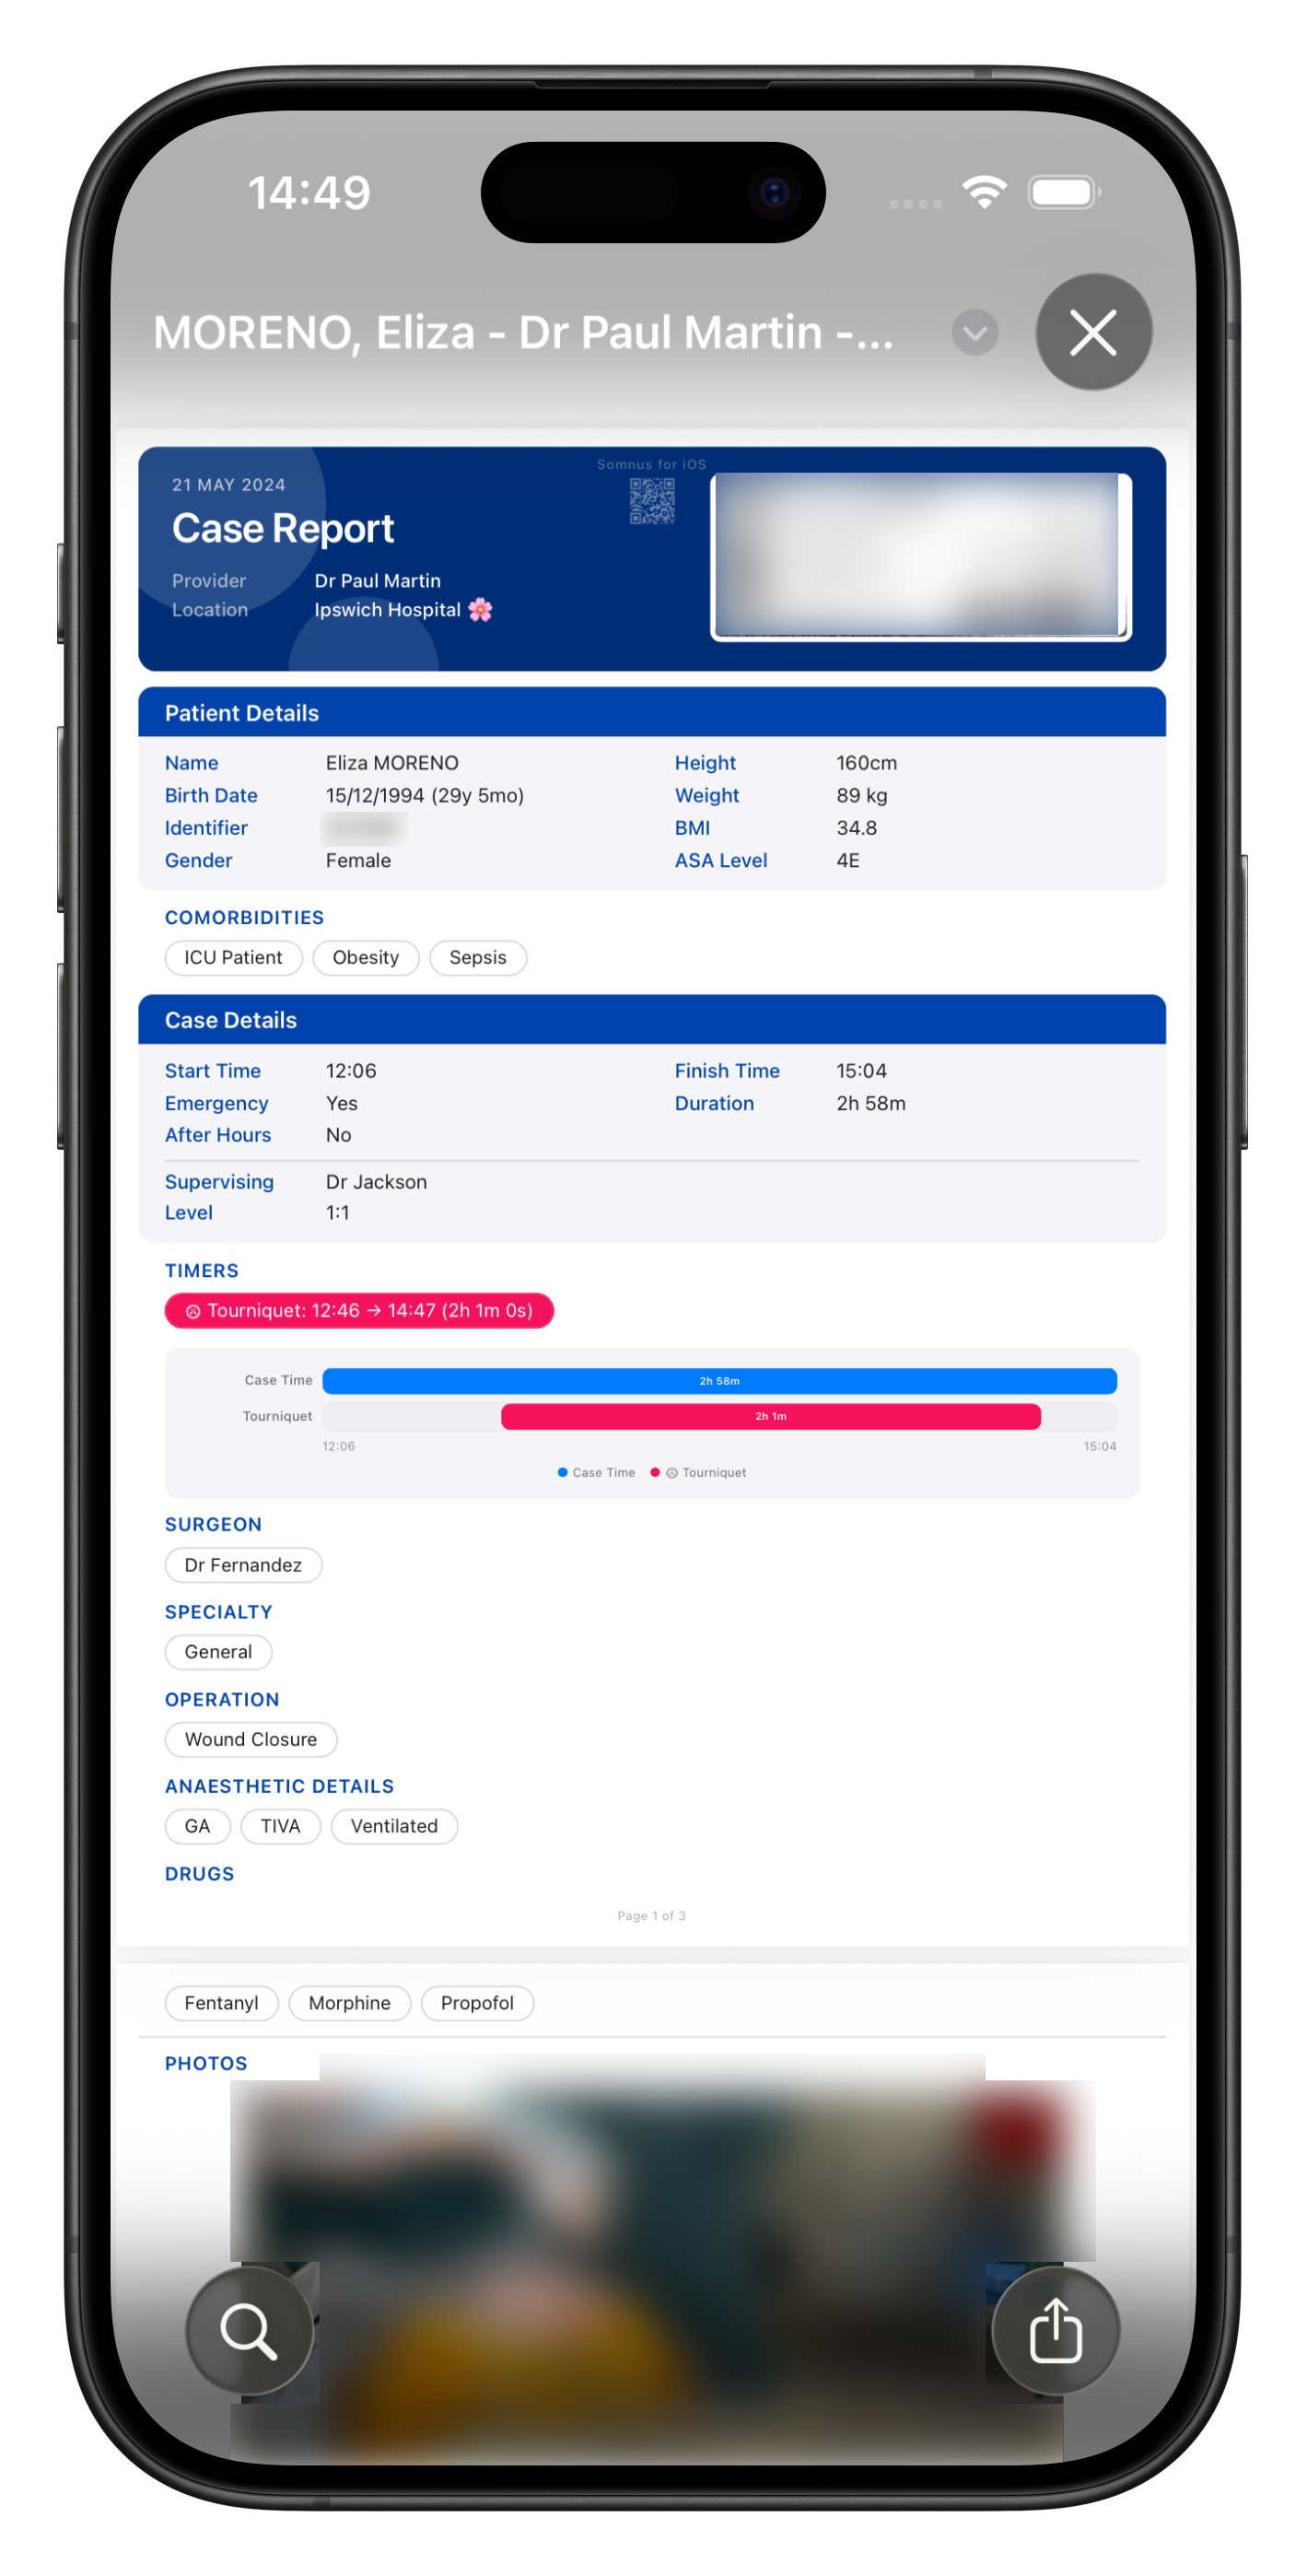
Case Reports (PDF)
A case report displays all relevant Case information, including Patient details, timers and any Notes (Case & Patient).
Deep Link QR codes & Patient ID Labels will also appear on these Case Reports and any Clinical Photos will be exported on separate pages if you've selected this in Settings. The order and visibility of the various sections is can also be configured there.
If you do not wish to export Photos or Clinical Documents (PDFs) with the Case Report, turn off 'Include Clinical Photos' or ‘Include Clinical Documents’ in Settings.
In order to export Case (or Billing) Reports, you must have 'Export Patient Details’ turned ON in Settings -> Security & Privacy.
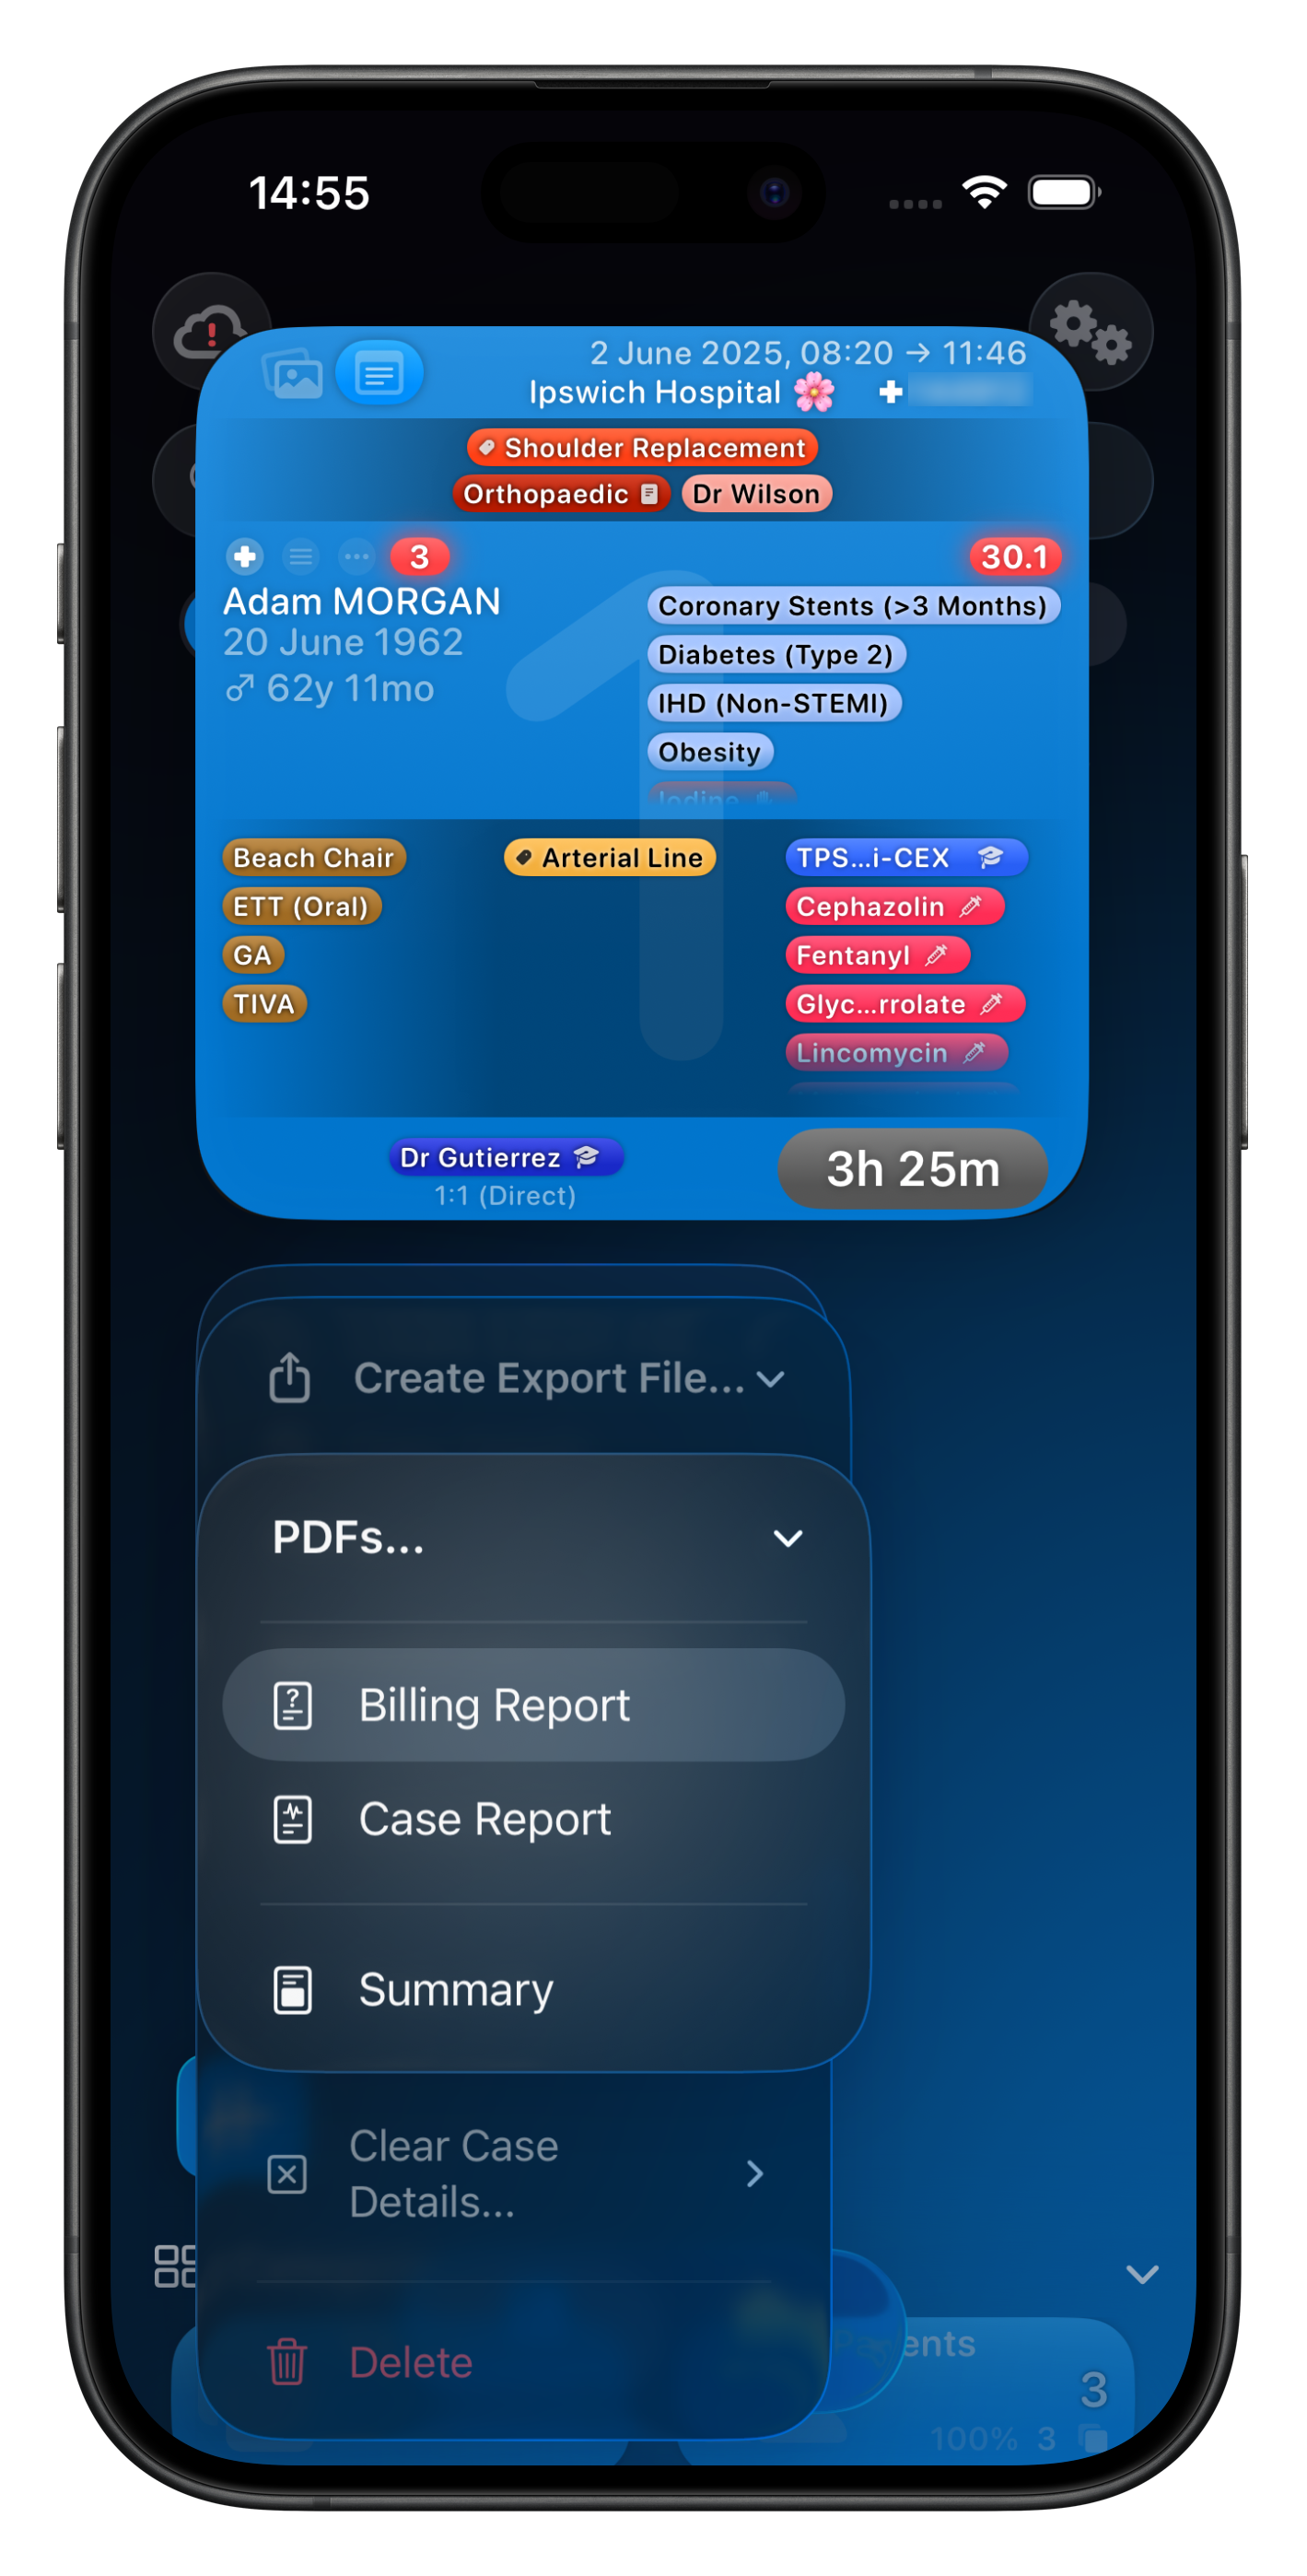
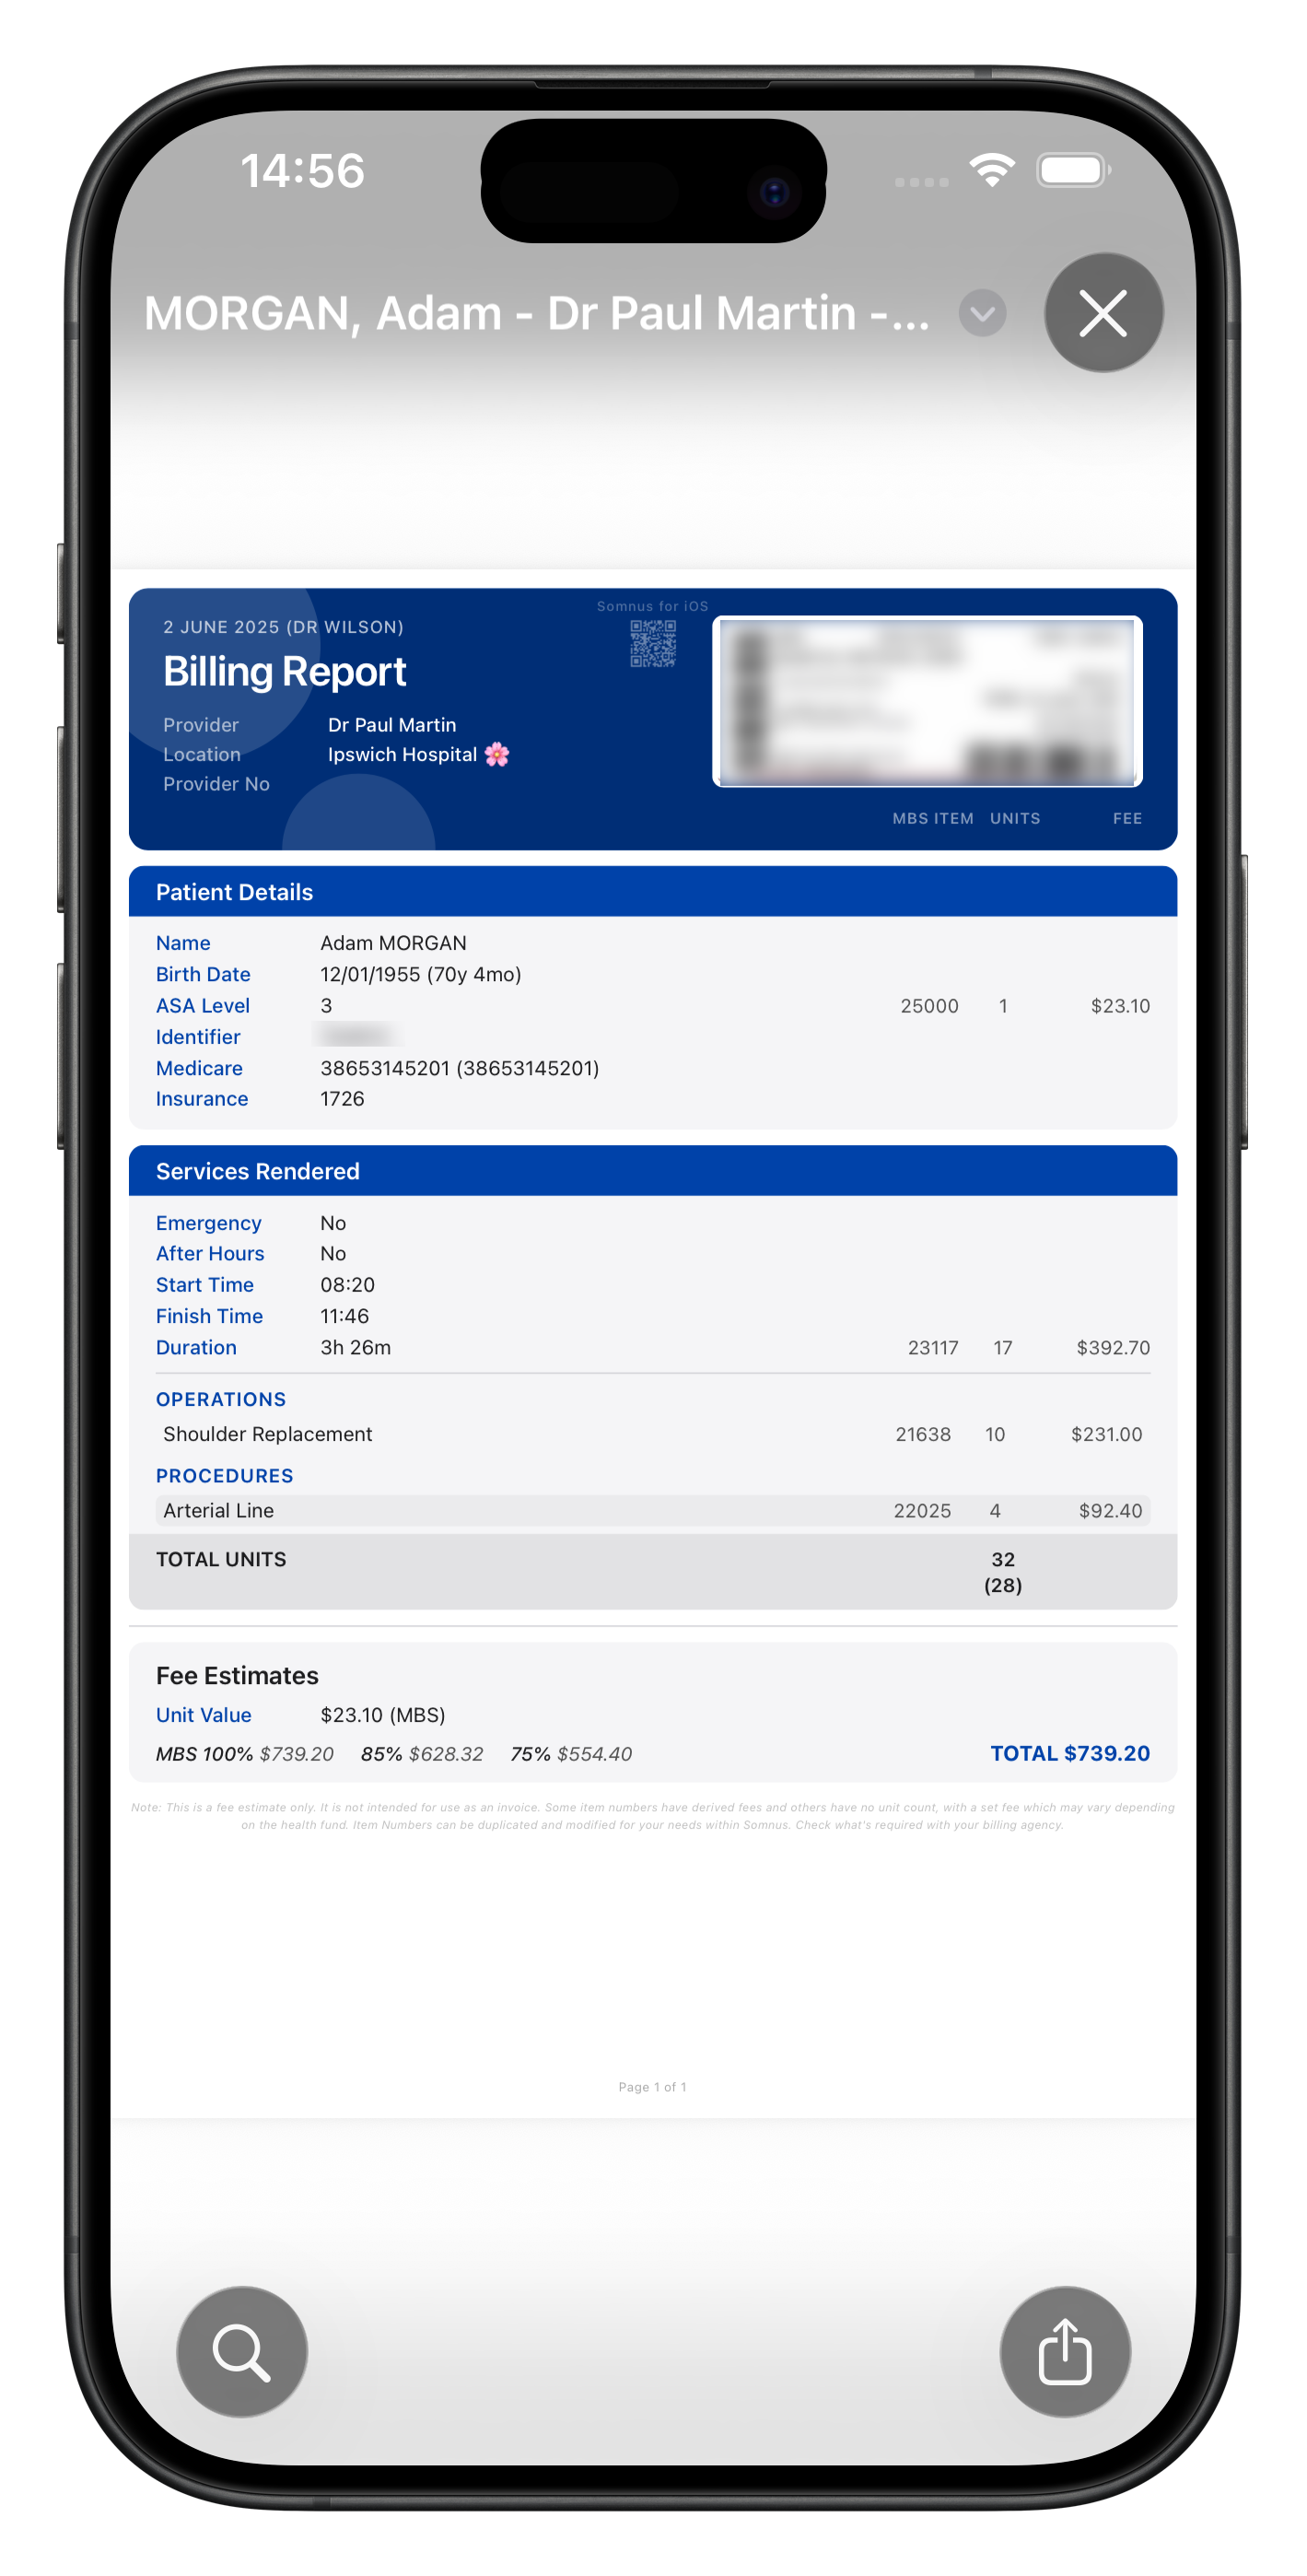
Billing Reports (PDF)
This will generate a report showing any operations, procedures and anaesthetic items with item numbers that were used during the case. Those without item numbers will not appear.
Deep Link QR codes, Patient ID Labels & Patient Notes (but not Case Notes) will also appear on these reports.
Item numbers for Operations, Procedures and Anaesthetic Items can be manually added by you. For Australian Users, they are added during the initial setup for the most common operations/procedures.
In addition to the RVG contained within Somnus, Somnus can automatically add MBS item numbers for case duration, patient age or ASA status, whether the case was an emergency (and if after-hours). See 'Time & Other Modifiers' in the Report section in Settings.
If you select 'Fee Estimates' you will see more detailed billing information, as well as a total and the varying MBS benefits paid.
The Unit Value for each case is shown. This will vary depending on whether you have set a custom value system-wide, or per patient.
If recorded, a Patient's Medicare & Insurance numbers will be shown. If you have selected 'No Gap' billing for a patient this will be prominently displayed, but with a fee estimate still visible based on the set unit value.
🔥 You can export a combined Billing Report PDF which includes all Cases for a day in a single file. Use the context menu on the Cases Summary Tile (eg. for a given day on the Dashboard).
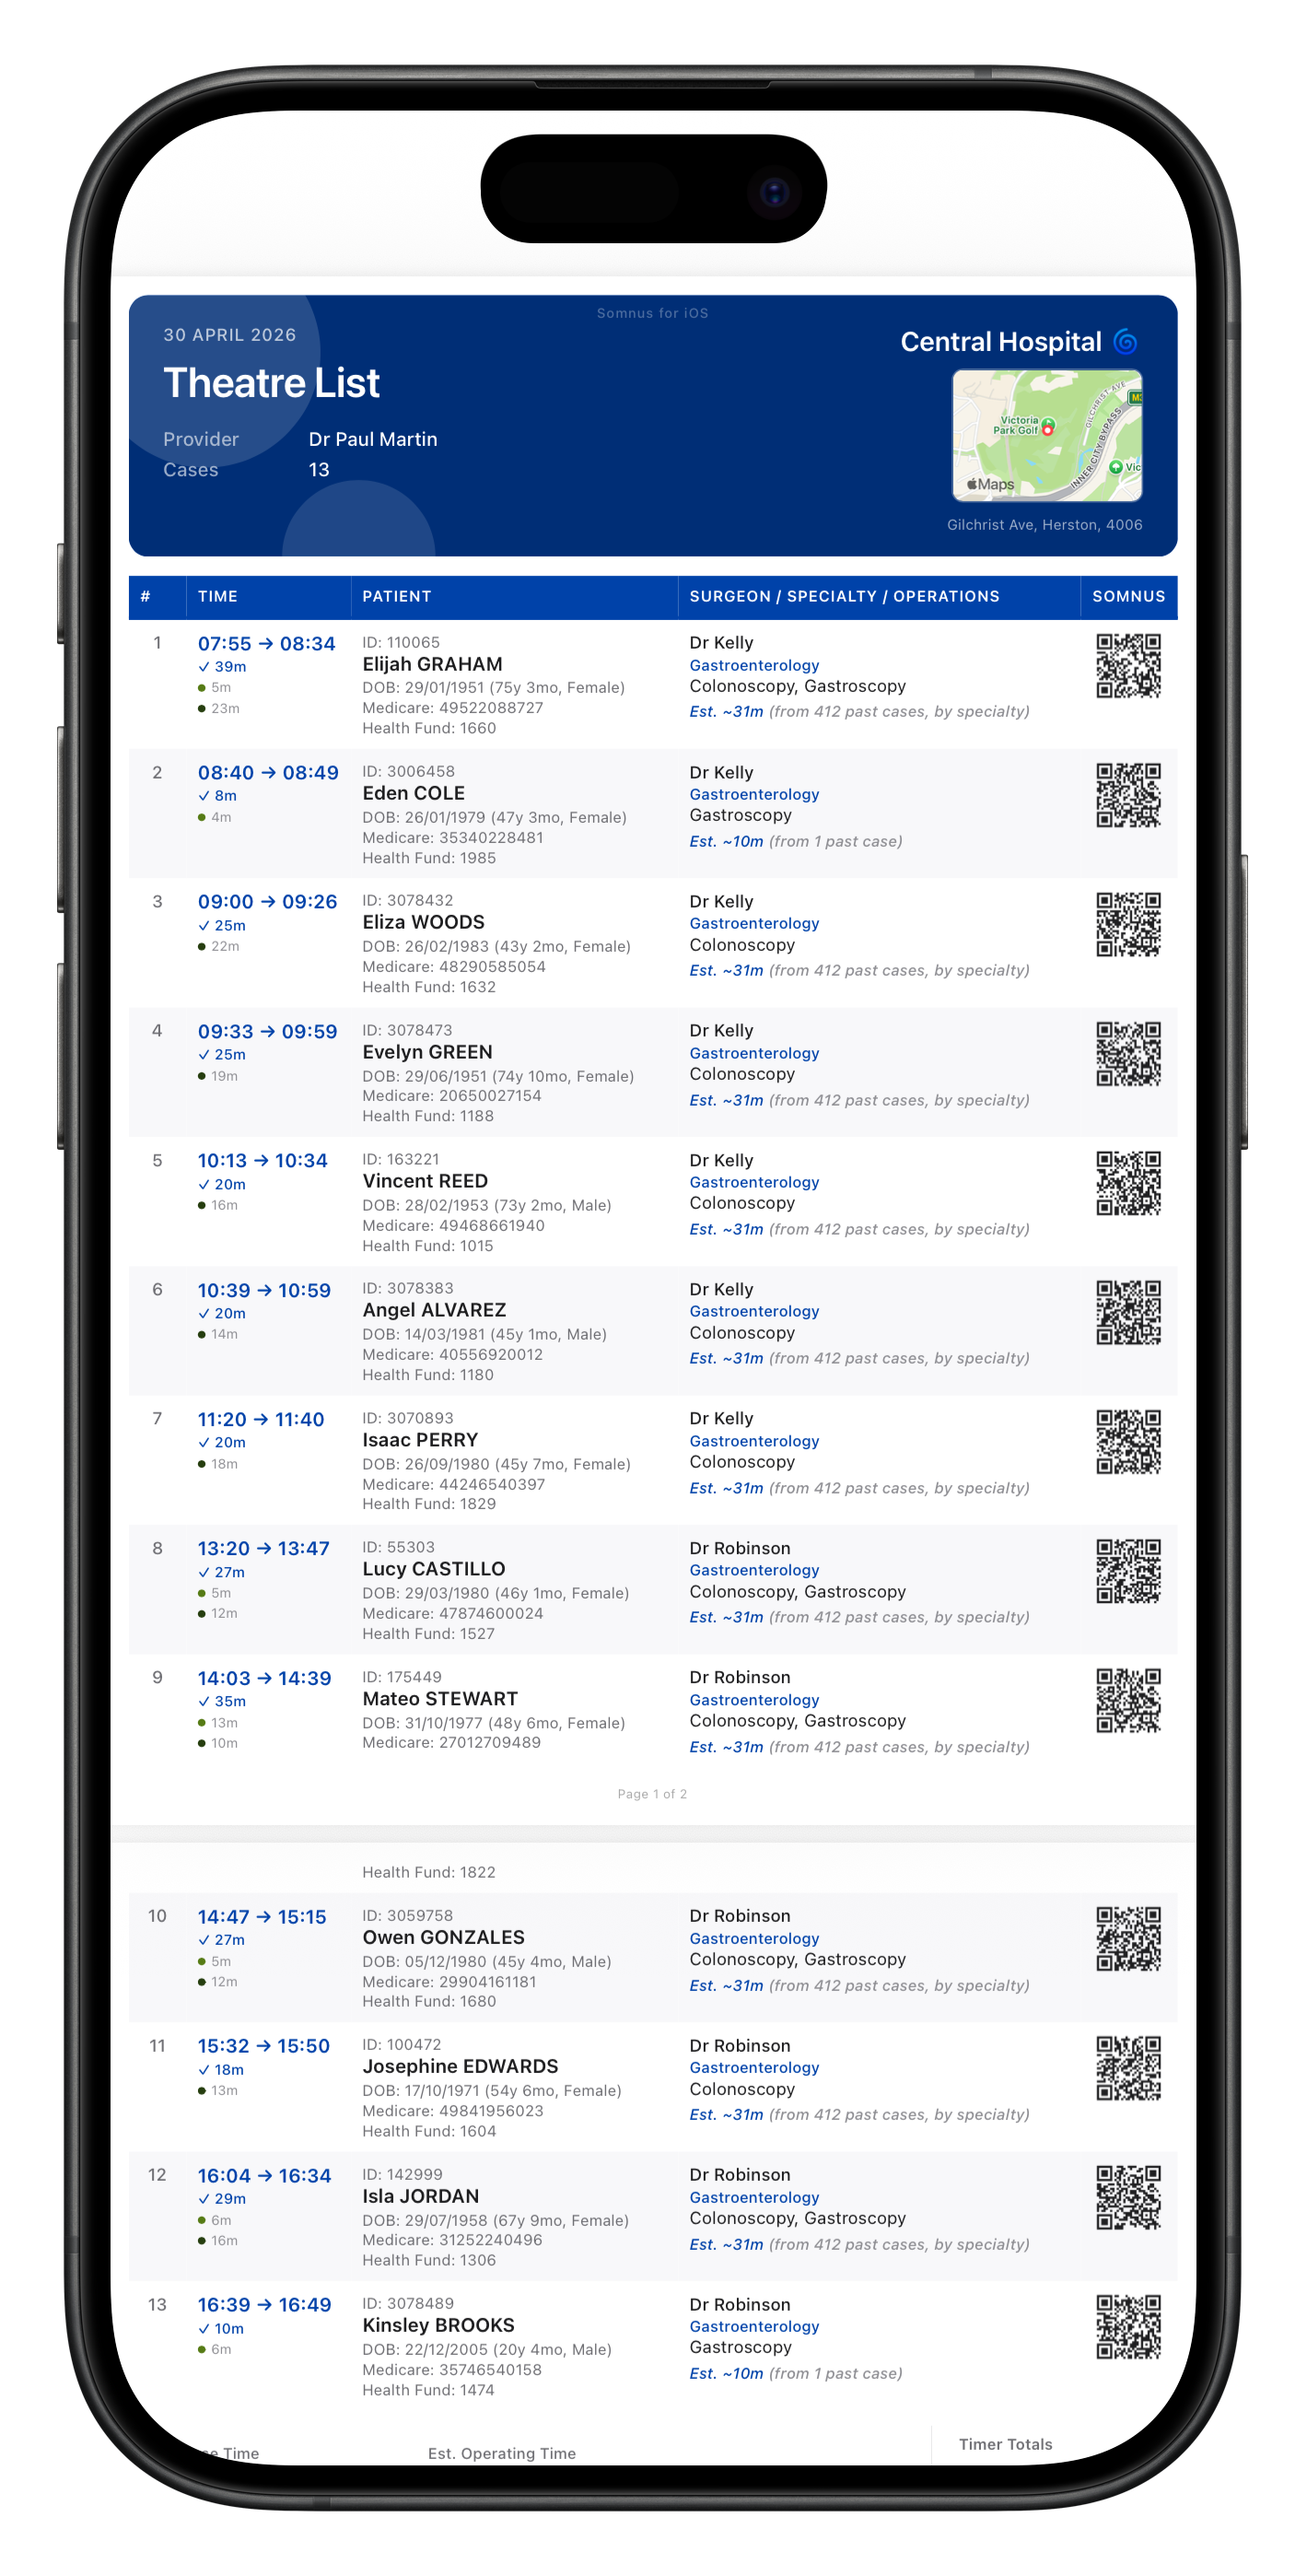
Theatre List (PDF)
Generate a polished, printable theatre list for any day's cases with a single tap.
Cases are automatically grouped by location and sorted chronologically, with each entry showing patient details, surgeon, specialty, operations, start and end times, and a QR code that links straight back to the case in Somnus.
The report estimates case durations based on your historical data — drawing from past cases matched by location, surgeon, or specialty — and calculates an estimated finish time for the list, including turnover between cases.
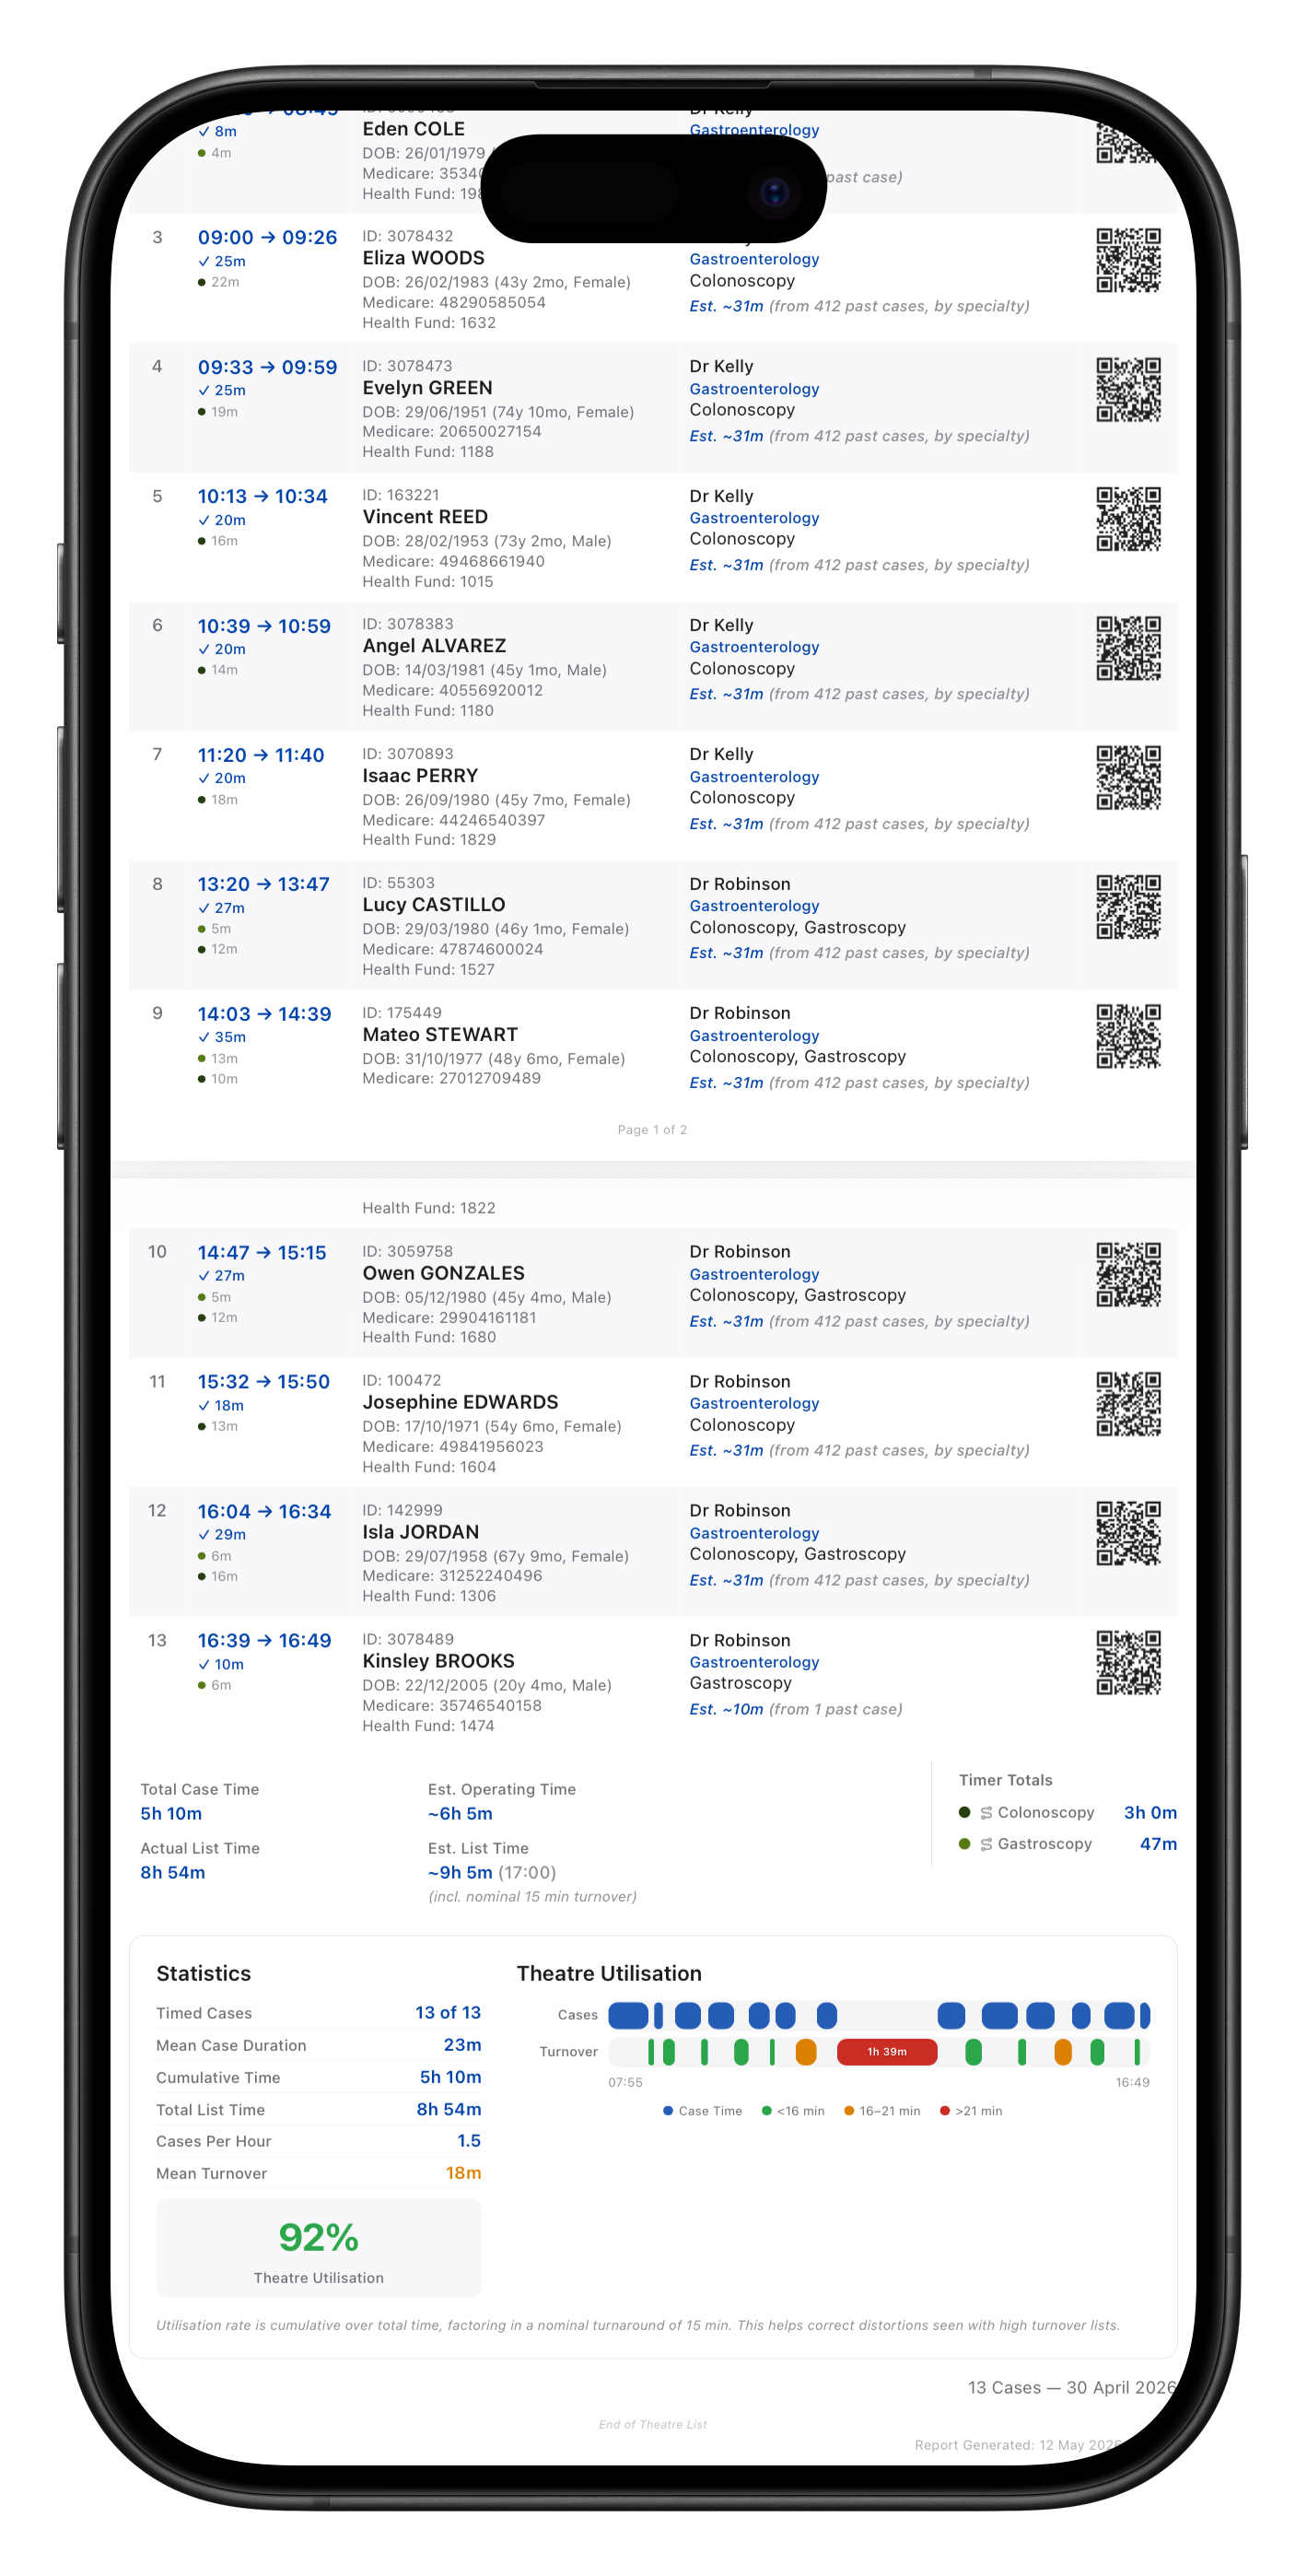
At the bottom of each list, a theatre utilisation summary breaks down your day: cumulative case time, cases per hour, mean turnover time, and an overall utilisation percentage so you can see at a glance how efficiently your theatre time is being used.
A visual timeline chart maps out each case and the gaps between them across the day, mirroring the chart on the Dashboard.
Share the PDF with your surgical team, print it for the theatre noticeboard, or save it to Files for your records.